Brent Near $100 as Red Sea Tanker Attacks Deepen Middle East Shipping Risk
🔔 Subscribe to ShipUniverse Weekly →
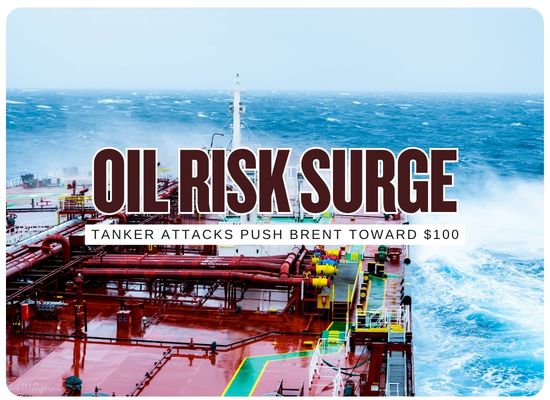
Brent crude surged to $98.59 a barrel on July 23, rising 4.8% and reaching its highest level since early June as another layer of maritime disruption entered an already unsettled Middle East energy market. U.S. West Texas Intermediate climbed to $90.22 a barrel, while crude prices advanced for a fifth consecutive session. The latest move followed attacks and threats involving tanker traffic in both major regional shipping corridors. Yemen’s Houthis said they targeted the Saudi oil tankers Encelia and Layla in the Red Sea, with Saudi authorities confirming that Encelia was struck and suffered a fire at its bow while its crew remained safe. The incident came as tanker movements through the Strait of Hormuz continued to face severe disruption from renewed U.S.-Iran hostilities, vessel attacks and sharply elevated insurance costs. The combination has left crude markets pricing shipping security across both the Persian Gulf exit and the Red Sea route at the same time.
Operator Impact Snapshot
Oil pricing, tanker security and war-risk insurance are moving together as renewed vessel attacks affect both the Persian Gulf exit and the Red Sea corridor.
Brent climbed to its highest level since early June and extended crude’s rally to a fifth session.
The U.S. benchmark moved back above $90 as supply-route concerns widened.
Additional premiums have risen sharply from roughly 1% to 3% only weeks earlier.
Encelia was confirmed hit and caught fire. The Houthis also claimed an attack on Layla.
Energy shipping is simultaneously facing disruption around the Persian Gulf and renewed risk near Bab el-Mandeb.
Energy & Shipping Risk Dashboard
Crude benchmarks, tanker incidents, insurance pricing and major oil-transit corridors are now showing elevated readings at the same time.
| Indicator | Current Reading | Recent Comparison | Maritime Signal | Stakeholder Exposure |
|---|---|---|---|---|
| Brent Crude | $98.59/bbl July 23 intraday level | Up $4.52, or approximately 4.8%, during the session. |
HIGH The benchmark moved toward $100 as the market priced additional supply-route risk. |
Tanker operators, bunker buyers, refiners, commodity traders and energy-intensive shipping segments. |
| WTI Crude | $90.22/bbl July 23 intraday level | Up approximately 3.9% during the session. |
HIGH The U.S. crude benchmark moved back above the $90 threshold. |
North American energy markets, refiners, commodity desks and marine-fuel pricing chains. |
| Red Sea Tanker Security | 2 tankers named by Houthi forces | Encelia was confirmed struck and suffered a bow fire. Its crew was reported safe. |
HIGH Tanker security pressure has expanded beyond the Persian Gulf into Saudi Arabia’s Red Sea export corridor. |
Saudi crude exporters, Red Sea tanker operators, insurers, charterers and Suez-linked energy trades. |
| Hormuz Additional War Risk | 7.5–10% of hull value | Approximately 1% to 3% of hull value only weeks earlier. |
EXTREME Insurance cost has become a major component of voyage economics for vessels entering the region. |
Shipowners, charterers, hull underwriters, cargo insurers, lenders and energy companies. |
| Strait of Hormuz Oil Flow | 20.9M b/d 1H25 reference flow | Equivalent to roughly one-fifth of global petroleum liquids supply at the time. |
SYSTEMIC The route remains one of the largest concentrations of seaborne energy movement in the world. |
Gulf exporters, Asian refiners, VLCC operators, LNG carriers and global commodity markets. |
| Bab el-Mandeb Oil Flow | 5.4M b/d 1Q26 reference flow | Flow had increased from 3.7 million b/d in the first quarter of 2025. |
WATCH Renewed Red Sea attacks place another major energy route under direct security pressure. |
Suez-bound tankers, Saudi Red Sea exports, Mediterranean refiners and Cape-routing operators. |
| Brent Q2 Volatility | $72–$118 quarterly price range | Average daily Brent price movement reached about $4 during April and May versus roughly $1 during the same months of 2025. |
VOLATILE Maritime access through Hormuz has already demonstrated the ability to produce unusually wide crude-price swings. |
Fuel procurement teams, charterers, traders, refiners and shipowners managing voyage budgets. |
Maritime Oil-Risk Exposure Simulator
Model the financial scale of a Middle East tanker transit using adjustable hull value, war-risk premiums, crude pricing and cargo volume. The calculator separates vessel insurance exposure from the benchmark value of the oil cargo so the two risks can be viewed independently.
We welcome your feedback, suggestions, corrections, and ideas for enhancements.
Please click here to get in touch