China’s Car Export Boom Could Send Record 2 Million Vehicles by Container in 2026
🔔 Subscribe to ShipUniverse Weekly →
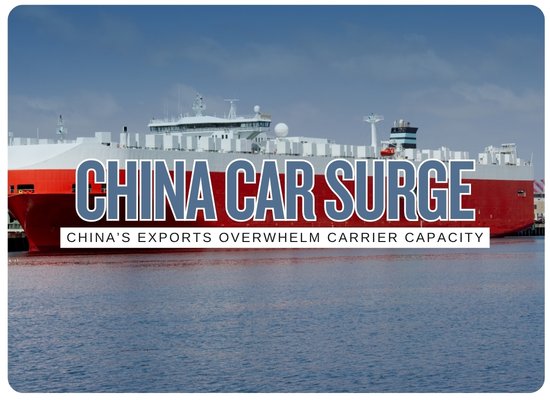
China’s accelerating vehicle exports are creating an unr-carrier and container-shipping markets. China is projected to export about 10 million light vehicles across all transport modes in 2026, up dramatically from 1.6 million in 2021, while approximately 4.06 million vehicles had already been exported during the first five months of this year. Dedicated pure car and truck carrier capacity is expanding, but not at the same pace as export volumes. Global PCTC fleet supply is expected to increase about 7.6% year over year, with part of that capacity arriving only as newbuildings are delivered throughout the year. The resulting gap is expected to push roughly 2 million vehicles into alternative shipping modes during 2026, primarily container ships, compared with more than 1 million last year. Containerized vehicle exports, once used largely as an overflow option during periods of tight ro-ro availability, are consequently becoming a much larger component of China’s automotive logistics network.
Operator Impact Snapshot
China’s vehicle export pipeline is expanding substantially faster than the immediately available specialist shipping base, increasing pressure across PCTC chartering, container allocation, terminal handling and finished-vehicle logistics.
Chinese light-vehicle exports across all transport modes are projected to reach approximately 10 million units this year.
Alternative shipping modes, primarily containers, could handle around twice the volume estimated for 2025.
New capacity is entering the market, but delivery timing means the full increase is not available for the entire year.
The one-year 6,500-CEU time-charter index has risen about 45% since the beginning of 2026.
Vehicle-carrier ordering has rebounded sharply from only two confirmed orders during the same period of 2025.
Vehicle Shipping Market Dashboard
China’s expanding vehicle export pipeline is now influencing several parts of the ocean transportation market simultaneously. Specialist PCTC tonnage remains heavily utilized, containerized vehicle movements are expanding, charter rates remain elevated and vehicle-carrier owners have returned aggressively to the newbuilding market.
| Market Indicator | 2026 Reading | Comparison | Shipping Signal | Stakeholder Exposure |
|---|---|---|---|---|
| China Light-Vehicle Exports | 10.0M projected full-year volume | Approximately 1.6 million vehicles were exported in 2021. |
HIGH PRESSURE
Five years of rapid export expansion have created a substantially larger requirement for outbound finished-vehicle shipping capacity. |
PCTC owners, charterers, terminals, container carriers, freight forwarders and automotive logistics providers. |
| January-May Export Pace | 4.06M vehicles exported | Up approximately 63% compared with the same period a year earlier. |
ACCELERATING
Early-year volumes indicate an export pipeline running far above recent historical levels. |
Export ports, vehicle storage yards, liner networks, PCTC operators and inland automotive logistics providers. |
| Alternative Shipping Modes | ~2.0M vehicles estimated in 2026 | More than 1 million vehicles were estimated to use alternative modes during 2025. |
RECORD RANGE
Containers are increasingly functioning as additional finished-vehicle capacity when dedicated car-carrier space cannot absorb the export pipeline. |
Container lines, NVOCCs, terminals, racking-system suppliers, securing-equipment providers and cargo insurers. |
| Vehicle-Carrier Fleet Supply | +7.6% expected year-over-year growth | New vessels enter progressively through the year rather than being available for all of 2026. |
WATCH
Headline fleet growth therefore overstates the additional capacity available across the entire trading year. |
Charterers seeking prompt vessels and OEMs negotiating longer-term ocean transportation agreements. |
| First-Half Capacity Balance | +3.3% fleet capacity growth | Global car-mile demand also increased approximately 3.3%. |
TIGHT BALANCE
Additional vessel capacity was effectively matched by additional transportation demand during the first half. |
PCTC charterers and cargo owners remain exposed to restricted vessel availability despite fleet expansion. |
| 6,500 CEU Charter Market | $63K/day one-year charter index | Approximately 45% higher than at the beginning of 2026. |
FIRM
Charter pricing continues to reflect competition for commercially available specialist vehicle-carrier tonnage. |
Charterers, vessel owners, lessors, financiers and operators evaluating fleet additions. |
| High-End Charter Fixture | $90K/day 7,060 CEU Lake Rotorua | Fixed to SAIC Anji Logistics in May at roughly a 70% premium to the 6,500-CEU one-year index at the time. |
PREMIUM TONNAGE
Individual fixtures illustrate the premium that can emerge when suitable modern tonnage is required at a specific position and timing. |
OEM-linked logistics companies, vessel providers and brokers handling large modern PCTCs. |
| Vehicle-Carrier Newbuildings | 29 confirmed first-half orders | Only two orders were recorded during the first half of 2025. |
CAPACITY RESPONSE
Owners and tonnage providers are responding to sustained utilization and export growth with another substantial wave of ordering. |
Shipyards, propulsion suppliers, cargo-system vendors, financiers and marine-equipment manufacturers. |
| Secondhand Asset Values | +10.5% approximately | Increase since the beginning of 2026 for 10-year-old standard 6,500-CEU and 4,000-CEU vessels. |
FIRM VALUES
Strong employment prospects and limited available capacity continue supporting existing vehicle-carrier asset values. |
Owners, lenders, lessors, buyers, sellers and maritime asset managers. |
| Destination Diversification | +235% Brazil, Jan-May | The UK, Belgium and Italy also recorded triple-digit growth in Chinese vehicle imports during the period. |
TRADE SHIFT
Export growth is spreading into additional long-haul markets instead of remaining concentrated within a narrow destination base. |
Deep-sea carriers, destination terminals, customs providers, inland transportation operators and distribution networks. |
Vehicle Export Capacity Analyzer
Translate China’s automotive export overflow into container demand, TEU requirements and equivalent PCTC capacity. The container allocation and loading assumptions are fully adjustable so different logistics scenarios can be tested without treating every alternative-mode vehicle as containerized cargo.