
🔔 Subscribe to ShipUniverse Weekly →
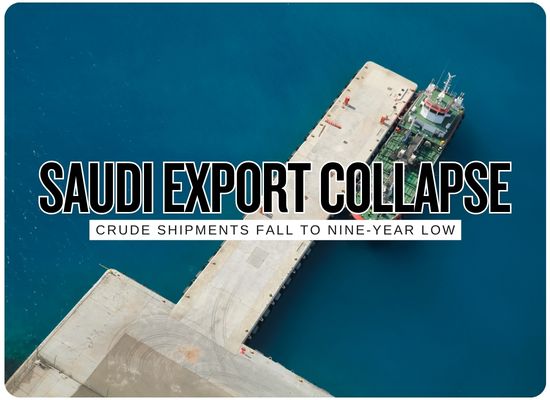
Saudi Arabia's observed crude exports fell to roughly 3.0 million barrels per day in August, the lowest level in tanker-tracking records going back to early 2017 and less than half the roughly 7.3 million bpd shipped before the regional war erupted in February. The decline is increasingly a maritime logistics problem rather than simply an OPEC production story. Saudi Arabia initially shifted enormous volumes through its 7 million-bpd East-West Pipeline to Yanbu after Hormuz became dangerous, but Houthi threats against Saudi shipping then squeezed the Red Sea exit as well. Yanbu exports dropped from about 4.3 million bpd in June to 2.25 million bpd in August, while Gulf Coast loadings also remained severely constrained. The latest escalation came when two VLCCs carrying a combined four million barrels of Saudi crude were struck while exiting Hormuz, with Saudi carrier Bahri later confirming that two seafarers aboard Sidr were killed.
Operator Impact Snapshot
Saudi loadings have fallen by roughly 59% since February
Observed August exports were only about 3.0 million bpd compared with roughly 7.3 million bpd immediately before the regional conflict began.
The bypass route has become another chokepoint
Yanbu initially absorbed much of the crude diverted away from Hormuz, reaching about 4.3 million bpd in June. Loadings then fell to 3.7 million bpd in July and roughly 2.25 million bpd in August after Houthi threats increased.
Attempts to restore Gulf exports have suffered another setback
Saudi Aramco resumed some Ras Tanura and Juaymah loadings during August, but two VLCCs carrying Saudi crude were struck while exiting Hormuz at the end of the month.
Fewer cargoes do not automatically mean fewer tanker days
Shipowners are combining dark voyages, ship-to-ship transfers, Mediterranean loading points and Cape diversions. The result can be fewer Saudi liftings but significantly longer voyages and more vessel time consumed by each delivered barrel.
Asian allocations are being handled less conventionally
Aramco has been negotiating some September volumes directly with customers rather than relying solely on its normal monthly allocation process as vessel availability and loading routes remain uncertain.
Every Export Workaround Now Carries a Trade-Off
Saudi Arabia still has several ways to reach the tanker market, but none currently replicates the speed, scale and simplicity of normal Gulf and Red Sea operations.
| Export Path | Recent Scale | Shipping Method | Constraint | Commercial Effect | Status |
|---|---|---|---|---|---|
| Ras Tanura / Juaymah → Hormuz | Gulf exports recovered to about 0.8M bpd in July before falling again in August. | Traditional direct VLCC loading | Tanker attacks, Iranian restrictions, extremely low vessel traffic and war-risk exposure. | Direct route remains highly efficient when available, but shipowners and buyers face exceptional security risk. | SEVERELY CONSTRAINED |
| East-West Pipeline → Yanbu |
4.3M bpd in June 3.7M in July ~2.25M in August |
Pipeline across Saudi Arabia followed by Red Sea tanker loading | Houthi blockade threat, reduced tanker calls, dark voyages and Bab el-Mandeb risk. | Originally the main Hormuz bypass. Its effectiveness is now limited by the maritime leg. | FALLING |
| Yanbu / Red Sea → Sidi Kerir | Mediterranean workaround expanded sharply during August. | Shuttle tanker and SUMED-linked movements followed by Mediterranean reloading. | Multiple handling stages, added vessel time, terminal capacity and higher freight. | Avoids southern Red Sea exposure but turns one direct voyage into a more complicated logistics chain. | WORKAROUND |
| Fujairah / Sohar STS | At least 4M barrels sold to China through recent STS arrangements. | Saudi crude moved to an outside-Hormuz transfer position and reloaded ship-to-ship. | Additional tanker coordination, security, STS availability and operational complexity. | Gives Asian customers access to Saudi grades without requiring the receiving ship to enter Hormuz. | EXPANDING |
| Cape of Good Hope | Multiple Saudi-linked VLCCs have already been observed rerouting around Africa. | Long-haul tanker voyage avoiding Bab el-Mandeb | Thousands of additional miles and roughly two weeks or more of extra vessel time in some voyage patterns. | Expensive per cargo, but extremely bullish for tanker ton-mile demand when used. | LONG ROUTE |
The observed difference is equivalent to about 133 million barrels over a 31-day month.
If the full export gap were expressed as standard two-million-barrel VLCC cargoes, it would equal roughly 67 fewer cargo equivalents every month.
Saudi Export Shock, VLCC Cargo & Detour Calculator
Translate the Saudi crude export decline into barrels, VLCC-equivalent cargoes, benchmark value and additional tanker demand created when surviving cargoes take longer routes.
Saudi Export Scale
Compare the entered pre-disruption export level with current observed exports and the resulting gap.
We welcome your feedback, suggestions, corrections, and ideas for enhancements.
Please click here to get in touch