OOCL Sends 24,188-TEU Megaship Back Through Suez as Major Carriers Rebuild Red Sea Services
🔔 Subscribe to ShipUniverse Weekly →
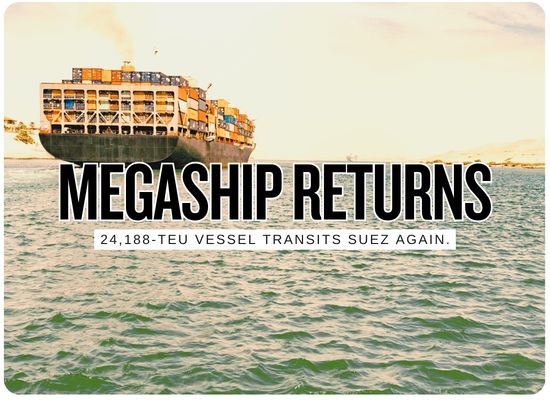
OOCL's 24,188-TEU OOCL Portugal transited the Suez Canal on September 16 while sailing from Belgium toward China, marking OOCL's first return and the first southbound transit by a COSCO Shipping-controlled vessel since Red Sea security disruptions pushed the group away from the route. The nearly 400-meter containership is deployed on the OCEAN Alliance NEU2 service between the Far East and Northwest Europe. Its passage comes as Maersk, Hapag-Lloyd, MSC and CMA CGM progressively restore selected services through Suez rather than around the Cape of Good Hope. The Suez Canal Authority reported 39 vessel transits totaling 2.3 million net tons on September 16, still well below the approximately 72 ships per day averaged during the canal's record 26,434-transit year in 2023, although container-ship net tonnage through Suez increased 54.2% year over year during the first eight months of 2026.
A 24,000-TEU Ship Returns to the Short Route
OOCL Portugal 24,188 TEUOOCL's megaship passed through Suez on its Belgium-to-China voyage, marking the carrier's first return and the first southbound transit by a COSCO-controlled ship since Red Sea disruption altered the trade.
The Suez Return Is Expanding, but It Is Not Complete
Major container lines are restoring selected loops and individual voyages while retaining Cape routings and contingency plans elsewhere in their networks.
| Carrier / Alliance | Current Suez Move | Services / Vessels | Direction | Cape Routing Still Used? | Current Position |
|---|---|---|---|---|---|
| OOCL / COSCO FIRST RETURN | OOCL Portugal completed the group's first major return transit since the Red Sea disruption. |
OOCL Portugal · 24,188 TEU OCEAN Alliance NEU2 |
Europe → Asia through Suez and the Red Sea. | Yes. One transit does not establish a complete network-wide return. | Important operational test because an ultra-large mainline vessel, rather than a feeder or smaller regional ship, has now used the corridor. |
| Maersk / Hapag-Lloyd STRUCTURAL RETURN | Four additional Gemini loops were announced for conversion from Cape routing to Suez. | AE5, AE11, AE12 and ME2 join AE15 and AE19. | Both eastbound and westbound transitions are being phased in on specified sailings. | Yes. The carriers have explicitly described the move as gradual and dependent on regional stability. | Six Gemini services are now either using or scheduled to use the trans-Suez corridor. |
| MSC CASE-BY-CASE | Selected East-West services have progressively resumed Red Sea and Suez passages. | Jade, Albatros, Himalaya, Tiger and selected Indusa sailings among announced restorations. | Varies by service. Indusa, for example, was announced westbound via Suez while eastbound continued via the Cape. | Yes, extensively. | MSC says implementation remains service-by-service with contingency arrangements retained. |
| CMA CGM / OCEAN Alliance EASTBOUND EXPANSION | Additional North Europe-to-Asia services have restored Suez passages. | FAL2 and FAL5 joined FAL3 and OCR among eastbound Suez routings. | Primarily eastbound on the listed services. | Yes. FAL2 and FAL5 remain Cape-routed westbound, while FAL6 and FAL8 continue around Africa. | A hybrid network is emerging rather than an immediate restoration of the pre-crisis routing structure. |
Suez vs Cape Voyage & Capacity Analyzer
Model how returning an ultra-large containership to Suez can change voyage time, sailing distance, ship utilization and route costs compared with the Cape of Good Hope.
We welcome your feedback, suggestions, corrections, and ideas for enhancements.
Please click here to get in touch