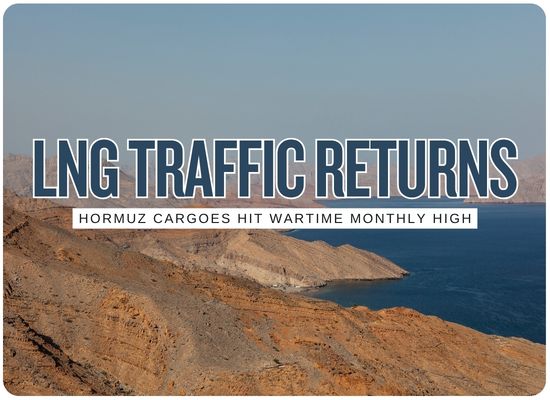
LNG shipping through the Strait of Hormuz accelerated sharply in September, reaching its highest monthly level since the U.S.-Israeli war with Iran began on February 28. S&P Global Energy counted 19 outbound LNG cargoes, including 13 from Qatar and six from the UAE, while Kpler counted 21, up from 15 in June. S&P analyst Eric Yep said activity accelerated during the second half of September and that, if the pace continues, October transits could recover to roughly 25% of prewar levels. The recovery remains unusually difficult to track because LNG carriers are frequently switching off AIS while crossing the strait, disappearing from commercial tracking systems and reappearing days later outside the Gulf.
Hormuz LNG Traffic · September 2026
The Recovery Is Happening Partly Off the Screen
LNG carriers are crossing Hormuz again in greater numbers, but many disappear
from AIS tracking during the highest-risk section of the voyage. The ships then
reappear days later in the Arabian Sea or near India, confirming that the crossing occurred.
S&P Global September Count
19
Outbound LNG cargoes through Hormuz, the highest monthly total
since the war began on February 28.
Origin of S&P's 19 Cargoes
Qatar
13
Roughly 68% of the S&P September tally originated from Qatar,
whose Ras Laffan complex historically dominates LNG exports through Hormuz.
United Arab Emirates
6
Roughly 32% came from the UAE, primarily through the country's
LNG export system inside the Gulf.
Three Late-September Qatar Cargoes Show the Pattern
Al Kharaitiyat
Last visible inside Hormuz around Sep. 22-23. Reappeared off western India around Sep. 29-30.
Al Gharrafa
Tracking disappeared inside the strait around Sep. 23-24. Reappeared west of India on Sep. 30.
Milaha Qatar
Last visible around Hormuz between Sep. 17-21. Reappeared west of India and discharged at Hazira.
Visible before transit AIS unavailable / dark transit Vessel reappears outside Gulf
June S&P Count15
September's 19 cargoes represent a 27% increase from that reference month.
September Kpler Count21
Kpler's tally is two cargoes higher than S&P Global's count.
Kpler Growth vs June+40%
Kpler also counted 15 outbound LNG cargoes in June.
October Signal~25%
S&P says October could reach roughly one-quarter of prewar transit levels if the late-September pace holds.
Two datasets, two totals:
S&P Global counted 19 September cargoes and Kpler counted 21.
Reuters does not identify the reason for the two-cargo difference. With vessels
switching AIS off during some crossings, exact real-time transit counts are inherently difficult.
Recovery Ladder · LNG Supply · Winter Risk
A Record Since the War Began Is Still Far From Normal
September represents a meaningful reopening of the LNG corridor, but S&P's
own October scenario would still leave Hormuz LNG traffic at only about one-quarter
of its prewar rate.
Transit Recovery Index
June Cargo Count
15 cargoes
September · S&P
19 cargoes
September · Kpler
21 cargoes
Possible October Rate
~25% of prewar
Prewar Operating Level
100%
Prewar Hormuz LNG Flow
11.4 Bcf/d
U.S. EIA estimate for the first half of 2025. That represented more than
one-fifth of worldwide LNG trade and was supplied primarily by Qatar.
Qatar's 2024 Flow
9.3 Bcf/d
Qatar accounted for the overwhelming majority of LNG moving through Hormuz.
UAE 2024 Flow
0.7 Bcf/d
UAE LNG provided most of the remaining outbound Gulf LNG flow.
Asia's Share
83%
Share of Hormuz LNG that went to Asian markets in 2024.
Top Asian Markets
China · India · Korea
Together they accounted for 52% of Hormuz LNG flows in 2024.
Three Market Effects to Watch
Contract Supply
Still Not Normal
QatarEnergy has extended force majeure on some European and Asian
deliveries despite the rise in ship movements. Edison alone is now
missing 35 contracted Qatari cargoes through early December.
Atlantic Replacement
U.S. LNG at 10.9 Mt
U.S. exports reached 10.9 million tonnes in September, with Europe
taking 54%, as Atlantic supply continues filling part of the Gulf shortfall.
Main Constraint
Security, Not Liquefaction
S&P says the key question is whether increased exports trigger
greater Iranian escalation and whether expensive U.S.-escorted convoys can continue.
The September milestone is a shipping recovery, not full LNG normalization.
More laden carriers are getting out of the Gulf, but long-term contract deliveries,
voyage scheduling and insurer confidence remain disrupted. A sustained October
improvement would be more significant than a single strong September.
Ship Universe LNG Transit Tool
Hormuz LNG Recovery Analyzer
Convert monthly LNG carrier transits into an illustrative gas-flow estimate
and compare the result with the prewar 11.4-Bcf/d Hormuz benchmark reported by the U.S. EIA.
cargoes
Bcf
Illustrative assumption based on a typical modern LNG-carrier cargo.
Actual cargo size varies by vessel and loading level.
Bcf/day
EIA first-half 2025 benchmark.
days
%
Default reflects 13 of S&P's 19 September cargoes.
cargoes
Scenario input only. No undisclosed extra cargo count is established by Reuters.
Annualized Transit Pace
228
current monthly cargo count multiplied by twelve
Cargoes for 25% Flow
~23
illustrative cargo equivalent under entered cargo-size assumption
Recovery Against Historical Flow
Cargo counts and gas-flow equivalents are different measures.
These bars convert the entered cargo assumptions into a simple physical-flow comparison.
Current Scenario
21.1%
25% Recovery
25%
Entered Recovery State
Partial Recovery
LNG traffic is meaningfully above the near-shutdown conditions seen earlier in the war,
but modeled throughput remains far below historical Hormuz volumes.
Visible Cargoes19
Dark Assumption0
Total Scenario19
Prewar Flow11.4 Bcf/d
Illustrative conversion:
Reuters and S&P report vessel counts, while EIA's historical benchmark is a gas-flow measure.
The 3.8-Bcf-per-cargo default is therefore an assumption used only to connect the two measures.
Actual LNG vessels and cargoes vary in size. The dark-cargo input should not be interpreted
as evidence that uncounted cargoes exist.