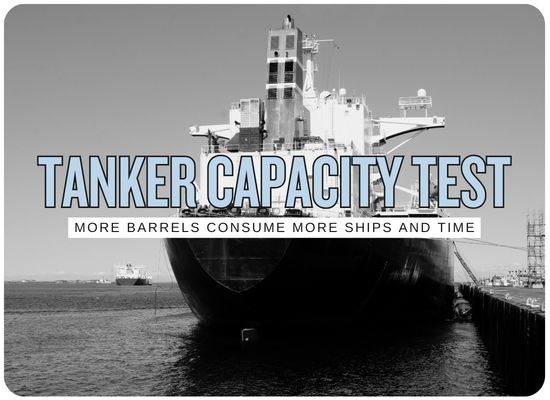
Oil Flows Are Back but the Shipping System Is Still Improvised
Middle East crude exports have recovered sharply. But the barrels are
moving through a logistics system built from shuttle tankers, high-risk
Hormuz transits, offshore ship-to-ship transfers and deepsea receiver
vessels. Every additional barrel now tests a different part of that chain.
12.8M bpd exportsHormuz shuttle fleetGulf of Oman STSSeptember 28, 2026
Emergency oil networkThroughput recovering
Regional exports
12.8M
barrels/day
Through Hormuz
7.4M
barrels/day
Saudi exports
5.4M
barrels/day
February gap
-6.0M
barrels/day
The system has recovered roughly two thirds of February export volume.
The next problem is not finding another barrel of crude. It is finding
enough transfer capacity, vessel-days and specialist operators to move it.
September has changed the operating picture. Crude exports from the main
Middle East producers are tracking around 12.8 million barrels per day,
the highest level since the conflict began in February. Roughly 7.4 million
barrels per day are expected to move through the Strait of Hormuz.
The recovery has not restored the old logistics model. Much of the new
throughput depends on a relay: crude loads inside the Gulf, a shuttle
tanker takes the high-risk leg through Hormuz, the cargo is transferred
outside the strait and a second vessel completes the long-haul voyage.
That architecture can move millions of barrels per day, but it creates
several capacity ceilings that did not exist when buyers could simply
send a VLCC into the Gulf, load it and sail directly to Asia.
The rebound
Oil supply has recovered faster than normal shipping patterns
September regional exports
12.8M bpd
Highest monthly pace since February.
February baseline
18.8M bpd
The system is still roughly 32% below that level.
Saudi September
5.4M bpd
More than double the 2.446M bpd recorded in August.
Saudi VLCCs last week
19
Roughly 38 million barrels of nominal VLCC cargo capacity.
How the system works
One export now consumes several separate maritime resources
1. Gulf loading terminal
Flowing
Crude is loaded at terminals such as Ras Tanura and Juaymah before
entering the high-risk shuttle leg.
Ras Tanura ~3.6M bpdSaudi eastbound surge
2. High-risk shuttle tanker
Tight
Specialized vessels carry crude through Hormuz rather than remaining
on the cargo for the full Asia voyage.
~54 VLCC shuttle fleetHigh crew premiums
3. Hormuz transit
High risk
The crude crosses the strait using an increasingly specialized
operating and security structure.
~7.4M bpd September flowNot normal traffic mix
4. Gulf of Oman STS transfer
At limit
The shuttle vessel meets a receiver VLCC outside Hormuz. Tugboats,
fenders, hoses, labour and safe transfer windows are all required.
A second vessel absorbs the cargo and the long-haul Asia voyage,
effectively splitting one trade into multiple ship employments.
Record freightLong waiting periods
6. Refinery delivery
Open
Cargo finally enters the normal refinery supply chain after consuming
additional vessel time and handling compared with a direct pre-crisis voyage.
The current hard stop
Gulf of Oman transfer support is already saturated
Crude STS flow
~6M
The transfer layer is struggling to add more throughput
Vortexa estimates roughly three new VLCC transfer pairs are
beginning operations each day while an operation now occupies
the system for close to 10 days.
Pair starts
~3/day
Approximate current operating pace.
Transfer duration
~10 days
Previously about five to seven days.
Illustrative occupancy
~30 pairs
3 starts/day × 10 days. Analytical approximation.
That implies roughly 60 vessel positions engaged in active transfers.
This is an illustrative queueing calculation rather than a reported
count of simultaneous STS vessels. It shows why doubling transfer
duration can absorb a large amount of tanker capacity even if the
number of daily starts does not change.
What reaches its limit next
Once STS spills east, tanker productivity becomes the next constraint
Pressure 1VLCC-days
Longer shuttle loops consume the available fleet
A vessel diverted to India or Malaysia can physically move the
crude, but it returns to the loading system much later.
Pressure 2Crew
The high-risk workforce is not infinitely expandable
Captains and crews on these voyages are receiving unusually high
risk compensation, while shuttle operations increasingly depend on
specialized operators.
Pressure 3Support
Alternative hubs need their own equipment and labour
Moving an STS position does not eliminate the requirement for
fenders, hoses, tug assistance, trained personnel and safe weather.
Pressure 4Freight
Record tanker earnings are the price signal for scarcity
Middle East-to-China VLCC time-charter-equivalent rates reached
around $1.27 million per day during the latest tightening.
Vessel productivity
Distance creates capacity, then gives much of it back
Gulf of Oman
0.12 mbd
West India
~0.09 mbd
Malaysia
~0.05 mbd
Malaysia provides physical space but nearly halves vessel productivity.
Kpler's observed shuttle cycle rises from about 17 days in the Gulf
of Oman to 21 days around West Coast India and 38.5 days for offshore
Malaysia.
Three-million-barrel test
The same oil flow can require more than twice as many VLCCs
Shuttle route productivity
Kpler scenario for roughly 3M bpd of incremental Saudi flow
Transfer point
Round cycle
Capacity / VLCC
VLCC requirement
Fleet penalty
Gulf of Oman
17 days
~0.12 mbd
~25
Baseline
West Coast India
21 days
~0.09 mbd
~32
+28%
Offshore Malaysia
38.5 days
~0.05 mbd
~58
+132%
Human capacity
The shuttle fleet also needs people willing to run it
Adnoc fleet expansion
$1.3B+
Lloyd's List reports investment in tanker capacity as the shuttle
system develops into a longer-term resilience strategy.
Reported crew compensation
2–3×
Captains and crews on high-risk Hormuz voyages are reportedly
receiving multiples of normal compensation.
Current shuttle fleet
~54
Kpler estimate of the VLCC fleet already involved in shuttle trades.
Additional Saudi requirement
36–40
Kpler base-case range for roughly 3M bpd of additional Saudi barrels.
Forty additional VLCCs would equal roughly three quarters of today's estimated shuttle fleet.
That is why the problem quickly stops being a simple question of whether
another tanker can be chartered somewhere in the global fleet.
Release valves
The system has four ways to avoid complete gridlock
Oman
Squeeze more capacity from existing STS areas
Kpler's base case assumes approximately 0.5M bpd could be created
through operational efficiencies.
India
Shift transfers toward West Coast India
Kutch, Mumbai and Vadinar provide the closest significant alternative,
although each shuttle becomes less productive.
Malaysia
Use established Southeast Asian lightering hubs
Linggi and nearby locations add physical transfer capacity at the
cost of much longer vessel cycles.
Direct
Skip the second STS operation entirely
Direct Middle East-to-Asia voyages relieve offshore transfer
congestion but keep a VLCC tied up for the full long-haul voyage.
The land-side release valve
The East-West Pipeline can remove pressure, but not immediately
Design capacity
7M bpd
Approximate full capacity of Saudi Arabia's East-West system.
Current status
Reduced
Pumping restarted after the September attack, but at reduced rates.
Repair horizon reported
6–8 wk
Reuters reported this estimate for return to full pipeline capacity.
Immediate implication
Maritime
The emergency tanker network remains important while repairs progress.
A clue from container shipping
Specialized shuttle operators are becoming a wider resilience model
Lloyd's List September 25
AD Ports-linked feeders now account for almost all recorded
container transits through Hormuz
Major global liner operators remain largely absent. The container
market is therefore beginning to resemble the tanker market:
specialized state-linked operators accept the high-risk leg while
conventional networks stay outside it.
The resilience system is becoming more concentrated, not less.
More cargo is moving, but a growing share of the difficult operating
work is being carried by a relatively small group of shuttle vessels,
crews, service providers and state-backed operators.
Research anchors
Data behind the emergency-network model
Reuters — September 28, 2026
12.8M bpd regional crude exports, 7.4M bpd through Hormuz,
5.4M bpd Saudi exports, 3.6M bpd Ras Tanura loadings and
19 Saudi VLCC transits during the previous week.
Reuters — September 25, 2026
Gulf of Oman STS capacity constraints, approximately three VLCC
pair starts per day, close to 10-day transfer operations, equipment
and labour queues and record VLCC freight.
Kpler — September 21, 2026
Gulf of Oman STS activity, 54-vessel estimated shuttle fleet,
17/21/38.5-day route cycles and the 25/32/58 VLCC route comparison.
Lloyd's List — September 15, 2026
Shuttle-fleet expansion, high-risk crew compensation and
integration of national security organizations into the operating model.
Lloyd's List — September 25, 2026
AD Ports-linked feeder operators dominating recorded container
transits while major global liner companies remain largely outside Hormuz.
Interactive emergency-network model
Middle East Oil Relay Capacity Stress Tool
Add more export volume and see where the barrels have to go once
Gulf of Oman STS capacity is exhausted. The model converts each
route choice into additional VLCC demand and vessel-day intensity.
Additional export pressure
1.0 mbd
0.5 mbd
0.5 mbd
Existing STS system
Modeled next constraint
Fleet productivity becomes the next bottleneck
Gulf of Oman absorbs part of the additional crude, but the
remaining barrels must move through less productive routes.
10 VLCCs
modeled incremental shuttle requirement
Where the additional barrels go
Gulf of Oman
0.5 mbd
West India
0.5 mbd
Malaysia
0 mbd
Gulf of Oman VLCCs
4.2
Additional steady-state fleet based on selected route productivity.
West India VLCCs
5.3
Additional vessels required for barrels allocated to West India.
Malaysia VLCCs
0
Long-cycle fleet requirement after nearer capacity is consumed.
Fleet penalty versus all-GoO
1.14×
Extra VLCC requirement caused by less productive transfer locations.
Modeled STS throughput ceiling
6.0 mbd
Pair starts per day multiplied by selected VLCC cargo size.
Illustrative concurrent STS vessels
60
Pair starts × operation duration × two vessels.
This is a logistics stress model, not a live chartering forecast.
Gulf of Oman, West India and Malaysia productivity assumptions are
based on Kpler's September 2026 route analysis. The model allocates
additional volume first to available Gulf of Oman capacity, then West
India and finally Malaysia. The STS throughput screen treats each pair
start as one VLCC-sized cargo and is therefore an analytical approximation.
Actual cargo sizes, partial transfers, repeat STS operations, weather,
equipment availability and direct voyages can materially change results.