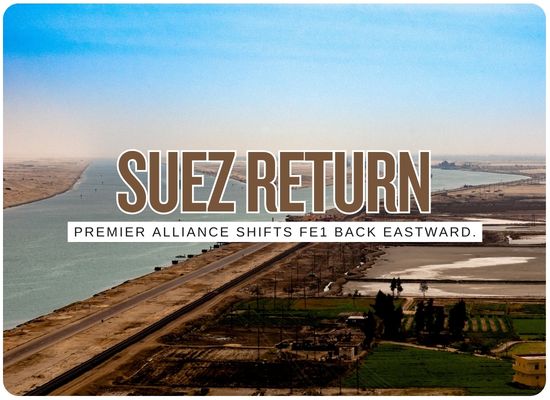
Premier Alliance members Ocean Network Express, HMM and Yang Ming will return their Southeast Asia-North Europe FE1 service to the Suez Canal this month, ending the alliance's Cape of Good Hope routing on that service for the first time since January 2024. The first scheduled switch is the 8,110-TEU ONE Continuity, departing Laem Chabang on October 17. The move joins a broader return that Linerlytica says has already moved more than 140 containerships representing over 2 million TEU back to Suez routings since May. Maritime Strategies International estimates roughly 35% of Asia-Europe sailings are now using the Red Sea. The commercial consequence extends beyond shorter transit times: every service that leaves the longer Cape route reduces the number of ship-days needed to move the same cargo, potentially releasing effective capacity into a market carrying a record 15.6 million TEU containership orderbook.
Premier Alliance · October 2026
FE1 Leaves the Cape Route and Heads Back Through Suez
ONE, HMM and Yang Ming are moving their Southeast Asia-North Europe FE1 loop back through the Red Sea and Suez Canal. The change brings the last major alliance holdout into the industry's expanding Suez return.
Previous Routing
Around Africa
FE1 had been routed around the Cape of Good Hope in both directions since the Red Sea disruption forced Premier Alliance away from Suez.
Laem ChabangCai MepSingaporeCape of Good HopeRotterdamHamburgLe HavreCape of Good HopeSingapore
→
October switch
Revised Routing
Red Sea + Suez
The revised service preserves the core Southeast Asia and North Europe calls while removing the long deviation around southern Africa.
The 8,110-TEU containership is scheduled to begin the revised routing from Laem Chabang on October 17.
Route abandoned
Jan. 2024
Premier Alliance's predecessor network moved European services away from Red Sea risk.
Return announced
Sept. 30
Linerlytica reported Premier's first structural switch back from the Cape.
First FE1 sailing
Oct. 17
ONE Continuity is scheduled to begin the revised service from Thailand.
Ships Back Since May
140+
Containerships returned to Suez routing according to Linerlytica.
Capacity Returned
>2M TEU
Aggregate ship capacity represented by those returning vessels.
Asia-Europe Sailings
~35%
MSI estimate of sailings currently using the Red Sea.
Latest Weekly Suez Peak
30 Ships
Ships above 4,000 TEU transiting in one week, the busiest since 2024.
Global Orderbook
15.6M TEU
Record newbuilding pipeline waiting behind the route normalization.
The Capacity Collision
Shorter Routes Release Ships While Shipyards Keep Adding Them
Cape diversions acted like a giant sponge for container capacity. Suez normalization squeezes that sponge at the same time the largest containership orderbook since the global financial crisis moves toward delivery.
Capacity Returning
Route normalization
The same cargo can be moved with fewer vessel-days when voyages shorten.
Returned since May>2.0M TEU
More than 140 containerships have already shifted back to Suez routing.
Cape-diverted fleet · Sept. 213.5M TEU
Linerlytica still counted about 250 ships on Cape routings at that point, down from roughly 380 ships and 5.4 million TEU earlier in 2026.
Suez transit momentum30 ships/week
Last week was the busiest for container ships above 4,000 TEU since 2024.
+
hits the market with
Capacity Arriving
Newbuild deliveries
The route change is occurring against a fleet already expanding rapidly.
Containership orderbook15.6M TEU
1,925 vessels are on order according to Linerlytica.
Orderbook / fleet>45%
The ratio has reached its highest level since 2009.
2027 fleet growth~9%
BIMCO expects physical fleet growth to accelerate as the delivery schedule builds.
Representative Suez Voyage
10,000 NM · 31 Days
UNCTAD's Shenzhen-Rotterdam example using the Suez Canal.
VS
Representative Cape Voyage
13,000 NM · 41 Days
The same UNCTAD comparison routed around the Cape of Good Hope.
Distance Difference
~3,000 NM
Representative distance removed when the voyage returns through Suez.
Transit-Time Difference
~10 Days
Fewer vessel-days are required for the same illustrative Asia-Europe movement.
Port Congestion Buffer
3.76M TEU
Linerlytica says congestion is still absorbing 10.9% of the global fleet.
Idle Fleet
~0.5%
The market remains tight today despite the structural capacity threat.
The oversupply does not have to appear all at once
Congestion, strong charter demand and selective Cape routing can continue absorbing ships. But Suez normalization removes one of the largest artificial sources of containership demand created during the Red Sea disruption.
Ship Universe Suez Capacity Tool
Suez Return Capacity Release Analyzer
Estimate how much ship-equivalent capacity could become available if more of the fleet still using Cape routings returns to the shorter Suez corridor.
M TEU
Default uses Linerlytica's September 21 estimate of 3.5 million TEU still on Cape routes.
%
days
Default uses UNCTAD's Shenzhen-Rotterdam example.
days
TEU
M TEU
M TEU
M TEU
Cape Capacity Returning
1.75M
entered Cape capacity multiplied by the selected normalization share
Illustrative Ship-Time Capacity Release
0.43M
modeled reduction in ship requirement using the entered voyage-time difference
Equivalent Ships Released
30
illustrative released capacity divided by the entered average ship size
Vessel-Demand Reduction
24.4%
modeled requirement reduction for the normalized voyages
Orderbook / Fleet Ratio
45.0%
entered global orderbook relative to existing fleet capacity
Congestion / Fleet Ratio
10.8%
capacity currently absorbed by port congestion under entered assumptions
Three Competing Capacity Forces
Route normalization releases ship-time capacity. Congestion temporarily absorbs it. The orderbook adds physical capacity regardless of which route is used.
Cape Capacity in Scope3.50M TEU
Modeled Ship-Time Release0.43M TEU
Newbuilding Orderbook15.60M TEU
Selected Scenario
50% Further Normalization
The calculator does not assume that returning ships become idle. Released capacity can be redeployed to other trades, support higher frequencies, allow slower steaming, absorb congestion or replace older ships.
Suez Time31 d
Cape Time41 d
Time Saved10 d
Return Share50%
Model limitation:
The default 31-day Suez and 41-day Cape figures are UNCTAD's representative Shenzhen-Rotterdam voyage, not Premier Alliance's complete FE1 round-trip schedule. Actual vessel savings depend on the full service rotation, port calls, buffers, sailing speeds, canal waiting time, security measures and schedule-recovery decisions. "Released capacity" therefore means illustrative ship-time capacity, not ships automatically becoming unemployed.
Feedback Welcome
We welcome your feedback, suggestions, corrections, and ideas for enhancements.