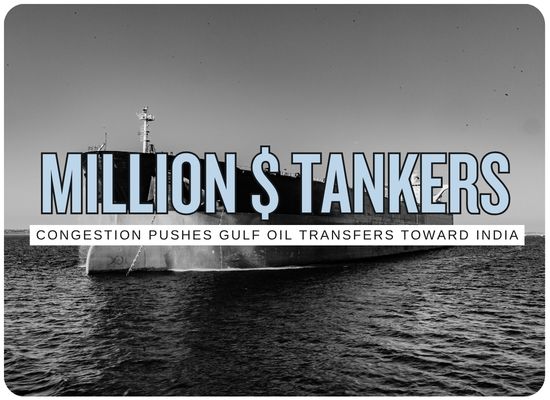
India Is Becoming the Overflow Valve for Hormuz Oil
The emergency shuttle system keeping Persian Gulf crude moving has
reached a new stage. Tanker rates have broken through seven figures,
full-VLCC transfers are consuming days at a time, and cargoes are now
being handed off as far away as India's Gulf of Kutch.
$1.27M/day record5–6 day cargo transfer~10 day STS system cycleKutch spilloverOctober 1, 2026
Congestion clock
Getting slower
Transfer infrastructure around Oman is saturated and more cargo is
moving toward India and Malaysia.
Relief clock
Yanbu restarting
Saudi Arabia's East-West Pipeline and Red Sea loadings are coming back,
potentially removing barrels from the Hormuz shuttle system.
The emergency network does not have a single breaking point. It survives
by consuming more ships, more vessel-days and more distant transfer
locations. The real limit arrives when those workarounds absorb tanker
capacity faster than they create export capacity.
The tanker market has reached a number that would have looked implausible
before the Hormuz crisis. The Middle East-to-China VLCC time-charter rate
reached a record $1.27 million per day in September as shuttling,
congestion and longer operating cycles removed ships from the available fleet.
The system keeping the crude moving is a relay. A tanker loads inside the
Persian Gulf, crosses Hormuz, and transfers its cargo to another VLCC
outside the strait. The receiver then continues toward Asia while the
shuttle vessel turns back toward the Gulf.
That relay worked because the receiving operation could be concentrated
near Oman. It is now spilling farther east. VLCC-to-VLCC transfers have
appeared in the Gulf of Kutch, while other ships are bypassing the
transfer network entirely and delivering Saudi crude directly to India.
Every step keeps oil moving, but every step also changes the number of
tankers required to move the same barrel.
Two different clocks
Five to six days does not tell the whole story
Current reporting describes both the physical transfer and the broader
time ships spend inside the STS system.
Vortexa transfer duration
5–6 days
Fully laden VLCC cargo transfer
Bloomberg reported that Vortexa now estimates five to six days
to complete an STS transfer from a fully laden VLCC.
Broader operating cycle
~10 days
Transfer plus system congestion
Reuters reported STS operations approaching 10 days as ships
compete for tugs, labour and transfer equipment around Oman.
The commercial bottleneck is system occupancy, not just pumping time.
A tanker may spend five or six days completing the physical transfer
while the wider operation consumes substantially more vessel time
through arrival, waiting, mooring support and departure.
Capacity mathematics
Three new transfer pairs per day can tie up dozens of VLCC positions
Illustrative steady-state occupancy
Three STS pair starts per day using current reported durations
5.5-day transfer
16.5 pairs
Approximate simultaneous physical transfer occupancy.
VLCC positions
~33
Two vessels are involved in each active STS pair.
10-day system cycle
~60 ships
Illustrative total vessel positions if the broader cycle persists.
These are Little's Law-style occupancy approximations, not AIS vessel counts.
They show how quickly a high-throughput transfer system can absorb
tanker positions when each pair remains inside the process for several days.
The million-dollar tanker
Every additional day now carries seven-figure time value
Record MEG-China rate
$1.27M/day
Time has become the scarce commodity
The September 21 LSEG assessment cited by Reuters provides an
unusually clear way to see how expensive congestion has become.
5.5 days / ship
~$7.0M
Time-charter-equivalent exposure.
5.5-day STS pair
~$14.0M
Two VLCC positions combined.
10-day STS pair
~$25.4M
Broader system-time equivalent.
This is not a demurrage calculation.
The figures simply apply the reported VLCC market rate to vessel-days
consumed by the transfer process. Actual charter-party exposure,
demurrage, STS fees and owner earnings will differ.
The spillover is here
Kutch is no longer just a theoretical overflow option
Gulf of Kutch signal
Persian Gulf crude transfers are appearing off western India
Recent completed transfers
2
VLCC-to-VLCC transfers identified by Bloomberg/Vortexa.
Additional operations
2+
Additional VLCCs reported conducting STS in the region.
Former shuttle VLCCs
13
Lloyd's List count linked to India delivery or West Coast India STS.
Distance penalty
India adds capacity by making every shuttle less productive
Gulf of Oman
0.12 mbd
West India
~0.09 mbd
Malaysia
~0.05 mbd
Round cycle17 days
Gulf of Oman
Highest shuttle productivity, but Fujairah and Sohar support
services are reported close to practical capacity.
~25 VLCCs for 3 mbdbaseline route
Round cycle21 days
West Coast India
Kutch and nearby west-coast locations release pressure from Oman,
but each vessel completes fewer shuttle cycles per month.
~32 VLCCs for 3 mbd+4 days
Round cycle38.5 days
Offshore Malaysia
Physical transfer capacity exists farther east, but vessel
productivity falls sharply as the shuttle distance expands.
~58 VLCCs for 3 mbd+21.5 days
Three-million-barrel-per-day test
The same crude flow can consume more than twice the fleet
Shuttle productivity and fleet requirement
Kpler September 2026 route analysis
Transfer area
Round cycle
Capacity / VLCC
VLCCs for 3 mbd
Fleet penalty
Gulf of Oman
17 days
~0.12 mbd
~25
Baseline
West Coast India
21 days
~0.09 mbd
~32
+28%
Offshore Malaysia
38.5 days
~0.05 mbd
~58
+132%
The price of moving the handoff
Four extra days to India are no longer a small operating penalty
Oman → West India
+4 days
Approximate Kpler round-cycle increase.
Rate-equivalent / VLCC
~$5.1M
Four days × $1.27M/day.
Malaysia penalty
~$27.3M
21.5 additional days at the same rate.
These values explain why direct delivery to India can become attractive.
A direct voyage does not eliminate tanker demand, but it can remove one
transfer event and return the shuttle vessel to productive employment
sooner than an increasingly congested two-ship relay.
How long can it work
The answer now depends on which clock moves faster
Clock A
STS congestion
More Gulf cargo lengthens queues, pushes transfers toward India
and Malaysia and increases the number of VLCCs required per
million barrels moved.
Clock B
Yanbu recovery
Restarting the East-West Pipeline moves Saudi barrels toward
the Red Sea again, reducing the volume that must cross Hormuz
and enter the STS relay.
Yanbu is already providing measurable relief.
Saudi Arabia has resumed Red Sea tanker loading after the East-West
Pipeline restart. Recent Yanbu crude loadings have been reported around
2 million barrels per day, with higher throughput expected as repairs continue.
The non-economic limit
The shuttle system can be operationally efficient and still remain physically exposed
October 1 security update
Three oil tankers were reportedly struck during Hormuz transits
Maritime intelligence service Marisks reported that three
Liberian-flagged tankers were hit by unidentified projectiles while
transiting the strait on Tuesday. One of the vessels, VLCC Mersin
Prosperity, had completed a Sohar STS operation involving Iraqi Basrah
crude earlier in September.
Research anchors
Data behind the tanker-capacity model
Bloomberg / Vortexa — October 1, 2026
Gulf of Kutch VLCC transfers, five-to-six-day fully laden VLCC
transfer duration and India becoming an overflow transfer location.
Reuters — September 25, 2026
Record $1.27M/day Middle East-to-China VLCC rate, approximately
three STS pair starts per day, queues for transfer support and
broader STS operations approaching 10 days.
Kpler — September 21, 2026
17-day Gulf of Oman, 21-day West Coast India and 38.5-day Malaysia
cycles; 25, 32 and 58 VLCC fleet requirements for the modeled
3M bpd case; current shuttle fleet around 54 vessels.
Lloyd's List Intelligence — September 30, 2026
Thirteen former Hormuz shuttle VLCCs identified delivering Saudi
crude directly to India or conducting transfers off India's west coast.
Reuters — September 29, 2026
Restart of the East-West Pipeline and resumption of crude loading
from Yanbu, providing a potential release valve for the shuttle system.
Reuters — October 1, 2026
Three tankers reportedly struck by unidentified projectiles during
recent Hormuz transits.
Interactive tanker capacity model
VLCC STS Capacity Burn Tool
Change tanker rates, STS duration, pair-start capacity and transfer
location to see how many VLCC positions the system consumes and how
expensive another day of congestion becomes.
STS operating system
$1.27M/day
5.5 days
10 days
3/day
Incremental oil movement
3.0 mbd
Modeled tanker capacity requirement
Gulf of Oman is the most vessel-efficient option
The selected route keeps the shuttle cycle shortest, although
physical STS infrastructure is already reported near capacity.
25 VLCCs
incremental fleet for selected flow
Fleet requirement for selected crude flow
Gulf of Oman
25
West India
32
Malaysia
58
Active physical STS pairs
16.5
Pair starts × physical transfer duration.
VLCCs in active transfers
33
Two vessel positions per active STS pair.
System pair occupancy
30
Pair starts × total system occupancy days.
System VLCC positions
60
Illustrative vessel positions involved in the broader process.
Physical transfer pair exposure
$14.0M
Two VLCCs × transfer duration × selected market rate.
Full system pair exposure
$25.4M
Two VLCCs × total occupancy × selected rate.
Fleet requirement vs current shuttle fleet
46%
Incremental route requirement versus selected existing shuttle fleet.
Route time penalty vs Oman
0 days
Additional round-cycle time created by moving the transfer point.
Time-value penalty / VLCC cycle
$0.0M
Route-time penalty × selected VLCC market rate.
Monthly incremental VLCC-days
750
Selected fleet requirement × 30 days.
This is a fleet-productivity and congestion screen, not a charter-party
cost calculation or forecast of how long the Hormuz system will remain
operational. The default route-productivity assumptions are calibrated
to Kpler's September 2026 estimates. The $1.27 million/day input is a
reported Middle East-to-China VLCC market rate and is used only to
express vessel-days in time-charter-equivalent terms. Actual STS fees,
demurrage, war-risk premiums, bunker consumption, waiting arrangements
and individual fixture economics can differ materially.
Feedback Welcome
We welcome your feedback, suggestions, corrections, and ideas for enhancements.