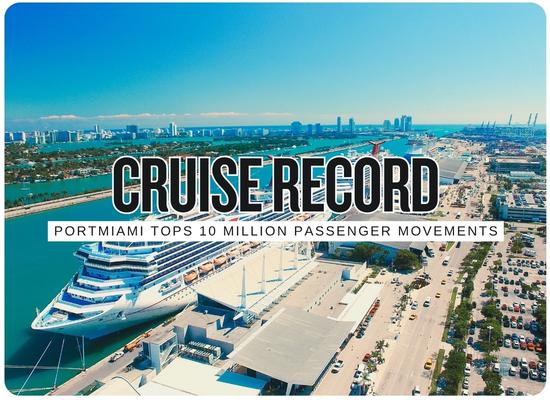
PortMiami Becomes First Cruise Port to Exceed 10 Million Annual Passenger Movements
🔔 Subscribe to ShipUniverse Weekly →
PortMiami crossed 10 million cruise passenger movements on September 14, 2026, becoming the first cruise port reported to break the 10-million threshold within a fiscal year. The milestone came about two weeks before PortMiami’s FY2026 closes on September 30 and already puts the port at least 1.44 million movements, or 16.8%, above its FY2025 record of 8,564,225. The figure measures passenger throughput rather than unique travelers: cruise ports count embarkations and disembarkations as separate passenger movements, meaning a round-trip passenger can contribute two movements. PortMiami’s growth coincided with a 2025-26 season that added 10 ships, including five newbuilds, as major cruise lines expanded Miami deployments and newer terminals increased processing capacity. Industry publications describe the 10-million mark as the first time any cruise port has reached that annual passenger-movement level.
Cruise-port statistics count embarking and disembarking movements. A passenger beginning and ending a round-trip cruise in Miami can therefore generate two passenger movements. The 10-million milestone measures the amount of passenger activity processed through the port.
The Capacity Stack Behind 10 Million
| Capacity Layer | Confirmed Scale | Timing | Throughput Effect | Next Capacity Step |
|---|---|---|---|---|
| FY2026 Ship Deployment | 10 new ships Five were newbuild vessels. | October 2025 through May 2026 arrivals included Queen Elizabeth, Brilliant Lady, Celebrity Xcel, Allura, MSC Grandiosa, Star Seeker, Eurodam, Norwegian Luna and Silver Nova. | Additional seasonal and year-round deployments increased available cruise berths and sailing frequency from Miami. | Cruise-line newbuild programs continue adding larger vessels and additional Miami deployments. |
| MSC Terminal AA | 36,000/day Maximum stated passenger-processing capacity. | Opened in 2025. | The 490,000-square-foot terminal can accommodate as many as three ships and is described by PortMiami as the world's largest cruise terminal. | Supports continued MSC fleet deployment and large simultaneous passenger exchanges. |
| Norwegian Cruise Line | 1.9M Minimum annual guaranteed passenger movements in FY2026. | Increased under the amended long-term PortMiami agreement. | The agreement ties newbuild deployment and greater year-round utilization to Miami. | Guarantee rises toward 2.2 million during the first decade of the revised agreement and ultimately 2.5 million annually. |
| Royal Caribbean Terminal G | 7,000 passengers Design capacity for large cruise vessels. | Groundbreaking took place in January 2026 with opening planned for 2027. | Adds a modern terminal, parking and intermodal infrastructure for Royal Caribbean and Celebrity operations. | Royal Caribbean's agreement is structured to eventually reach 2.1 million annual passenger movements at Terminal G/Berth 10. |
| Peak-Day Operations | 72,401 guests PortMiami's busiest passenger day recorded April 20, 2025. | The port also handled a record 10 cruise ships on February 8, 2025. | Demonstrated the ability to handle passenger loads far above the annual daily average during concentrated weekend turnaround periods. | Higher annual volumes increase pressure on terminals, road access, baggage handling, parking and federal passenger-processing systems. |
| Shore Power | 5 berths Three vessels can connect simultaneously. | Program launched in 2024 and expanded across major cruise terminals. | Allows compatible ships to shut down onboard engines while berthed, supporting high-volume cruise operations with lower local emissions. | Continued growth increases the importance of electrical, berth and landside infrastructure operating together. |
| Port Canaveral Benchmark | 8.60M FY2025 multi-day passenger movements. | Port Canaveral was the world's busiest cruise port in FY2025. | Its FY2026 operating plan projected approximately 9 million movements across 1,083 ship calls. | FY2026 final results were not yet published when Miami crossed 10 million on September 14. |
10 Million → 12 Million: Port Throughput Planner
Model how much additional ship and terminal activity would be needed to move PortMiami from today's 10-million milestone toward a higher annual passenger-throughput target.
Cruise demand is highly concentrated around turnaround days, especially weekends. Annual averages therefore do not represent the actual terminal, road, baggage, parking or CBP load experienced during the port's busiest operating windows.
We welcome your feedback, suggestions, corrections, and ideas for enhancements.
Please click here to get in touch