Drewry WCI Rises Again as U.S.-Bound Container Rates Break Higher
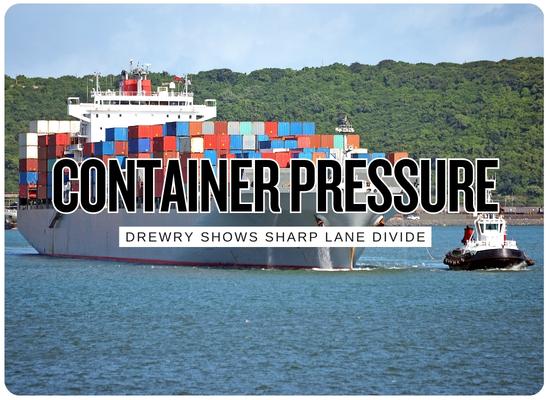
Drewry’s latest World Container Index rose 1% on August 13 to $4,339 per 40ft container, marking the second consecutive weekly increase after the late-July slide. The headline gain was driven by U.S.-bound Transpacific pricing, with Shanghai to New York jumping 10% to $8,706 and Shanghai to Los Angeles rising 6% to $6,244. Asia-Europe moved in the opposite direction, with Shanghai to Genoa falling 8% to $5,080 and Shanghai to Rotterdam dropping 5% to $4,425. The report described a volatile East-West container market shaped by tighter capacity, blank sailings, carrier surcharge announcements, security concerns around Suez and Hormuz, Panama Canal restrictions, Asian port congestion after Typhoon Dolphin, and Rhine low-water pressure on inland transport.
Ship Universe Container Rate Watch
Operator Impact Snapshot
The composite index moved only 1%, but the route split underneath it was much sharper.
The latest WCI report shows a divided container market: U.S.-bound Transpacific rates are rising again while Asia-Europe spot rates are losing ground.
Transpacific rate pressure
Shanghai to New York jumped 10% and Shanghai to Los Angeles rose 6%, turning U.S.-bound cargo into the strongest pricing story in the report.
Composite index support
The WCI rose for a second consecutive week to $4,339 per 40ft container, suggesting the market has not returned to the late-July downtrend.
Asia-Europe rate pullback
Shanghai to Genoa fell 8% and Shanghai to Rotterdam fell 5%, showing weaker momentum despite constrained capacity on the lane.
Blank-sailing discipline
Carriers have been restricting space on the Transpacific, with 10 cancellations in each of the past two weeks and seven planned for the next week.
Surcharge stack risk
Panama Canal surcharges, security-related route uncertainty, inland water constraints, and congestion can raise the all-in cost beyond the base ocean rate.
Commercial Reading
The current WCI story is not a broad global rate boom. It is a lane-specific pricing rebound led by Transpacific capacity control and U.S.-bound demand.
- BCOs: U.S. import budgets need a lane-by-lane review because East Coast and West Coast rates are now moving faster than the composite index.
- Forwarders: rate volatility gives room for repricing, but customer pushback may rise if Europe lanes are weakening at the same time.
- Carriers: blank sailings are supporting prices, but too much capacity discipline can increase rollover risk and service complaints.
- Ports: congestion and weather disruption in Asia are now part of the rate-support story, not just an operations issue.
- Shippers using Panama routings: surcharge announcements make all-in landed cost more important than the ocean base rate alone.
WCI Rate Board
Transpacific Strength Against Asia-Europe Weakness
The latest WCI table shows rate power concentrating on U.S.-bound lanes while Europe lanes soften.
Latest WCI Numbers
Up 1% per 40ft container, marking the second consecutive weekly increase.
Up 10%, the sharpest route move in the latest assessment.
Up 6%, confirming renewed Transpacific pricing pressure.
Down 8%, showing Mediterranean spot-rate weakness despite announced FAK increases.
Down 5%, reflecting a softer North Europe lane.
Ten blank sailings in each of the past two weeks, with seven cancellations planned for next week.
Rate and Cost Table
| Lane or Driver | Latest Figure | Market Signal | Commercial Effect | Pressure Meter |
|---|---|---|---|---|
| Composite WCI Global benchmark | $4,339 per 40ft, up 1%. | Second weekly increase after a late-July decline period. | The headline number shows support, but lane-level divergence matters more. |
Medium High
|
| Shanghai to New York Asia to U.S. East Coast | $8,706 per 40ft, up 10%. | Strongest pricing lane in the report. | East Coast importers face the highest rate pressure and Panama-linked surcharge exposure. |
High
|
| Shanghai to Los Angeles Asia to U.S. West Coast | $6,244 per 40ft, up 6%. | West Coast rates also strengthened, but remain below East Coast pricing. | West Coast routing can still be a cost-control option if inland rail and transload capacity are available. |
High
|
| Shanghai to Genoa Asia to Mediterranean | $5,080 per 40ft, down 8%. | Mediterranean pricing weakened even as some carriers announced higher FAK rates. | The gap between announced rates and demand strength will decide whether increases stick. |
Watch
|
| Shanghai to Rotterdam Asia to North Europe | $4,425 per 40ft, down 5%. | North Europe lost momentum despite limited blank sailing announcements. | Rate softness may be offset by inland delays if Rhine low-water disruption continues. |
Medium
|
| Blank Sailings Capacity control | 10 cancellations in each of the last two weeks, seven planned next week on Transpacific. | Carriers are actively restricting space to support rates. | Lower available capacity can raise rollover risk even when ships are still sailing. |
High
|
| Panama Canal Surcharges Asia to U.S. East Coast and Gulf | Carrier surcharge announcements are stacking onto base ocean freight. | Canal cost and restriction risk are now part of the Transpacific all-in rate story. | All-in freight files need to separate ocean rate, canal surcharge, fuel, congestion, and inland adders. |
High
|
| Disruption Stack Suez, Hormuz, Asia ports, Rhine | Drewry cited security, waterway, congestion, and inland-transport disruptions together. | Multiple small constraints can combine into a larger reliability problem. | The rate quote may be only one part of the landed-cost and lead-time picture. |
High
|
WCI Booking Pressure Calculator
Estimate ocean freight exposure, surcharge stack, delay cost, and booking pressure using the latest Drewry lane figures.
This tool converts the latest WCI lane rates into an all-in planning estimate for a shipment block.
Ocean Base Cost
$261,180
Selected WCI lane rate multiplied by 40ft container count.
Total Freight With Surcharges
$284,430
Ocean base cost plus selected surcharge and canal-cost assumptions.
Delay Exposure
$4,200
Estimated cargo delay cost if blank sailings, congestion, or inland disruption affect the move.
Next Move Exposure
$14,222
Estimated freight change if rates move by the selected percentage before booking.
Booking Signal
The model shows elevated booking pressure. High lane rates, limited space, surcharges, and cargo urgency make waiting risky.
We welcome your feedback, suggestions, corrections, and ideas for enhancements.
Please click here to get in touch