New ULCS Wind-Tunnel Tests Find Port Structures Can Cut Mean Crosswind Loads 30–45%, But Extreme Loads Do Not Fall Proportionally
🔔 Subscribe to ShipUniverse Weekly →
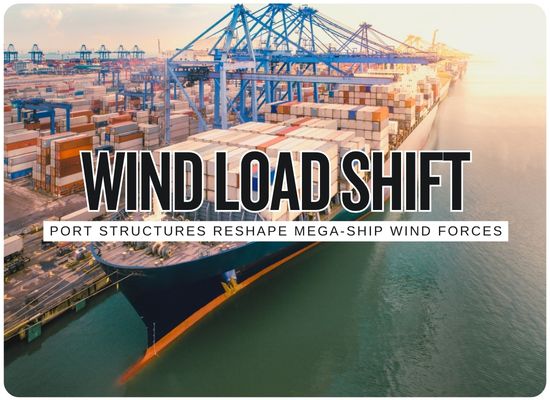
New boundary-layer wind-tunnel research into ultra-large container ships has found that surrounding port infrastructure can substantially reduce average aerodynamic loads on a moored vessel without producing an equivalent reduction in its extreme response. The 53-page study, posted to SSRN in September, tested empty, intermediate and fully loaded ULCS configurations using six-component force measurements and surface-pressure measurements in idealized harbor environments. None of the empirical wind-load formulations examined consistently reproduced every measured force and moment component. Port structures reduced mean transverse loading by as much as approximately 30–45% relative to an empty-quay environment in some tested configurations, but the researchers found that extreme response did not fall proportionally. A modeled storage-tank terminal even amplified low-frequency yaw-moment variance at selected wind directions while reducing other load components.
The Port Is Part of the Aerodynamics
Buildings, container stacks and terminal structures do more than block wind. The experiments show that they can reshape the magnitude, direction and frequency content of aerodynamic loads acting on a moored mega-ship.
What the Researchers Actually Tested
The experiments varied both the ship itself and the environment around it, allowing the team to separate changes in overall aerodynamic magnitude from changes created by the port.
| Research Element | Test / Finding | What Changed | What the Result Shows | Important Limit |
|---|---|---|---|---|
| Ship Loading Condition | 3 CONFIGURATIONS Empty · Intermediate · Full | Container-stack configuration changed the ship's exposed geometry and windage. | Loading condition primarily governed the overall magnitude of aerodynamic loading. | Results from one loading configuration should not automatically be transferred to another. |
| Measurement System | PHYSICAL TESTING 6-Component Force Balance | Forces and moments were measured together with surface-pressure measurements. | The researchers could examine not only total load but how the pressure field and moment response changed. | These are controlled wind-tunnel environments, not full-scale measurements from every possible port geometry. |
| Port Infrastructure | SHIELDING + REDISTRIBUTION Up to 30–45% Mean Reduction | Idealized harbor structures altered the flow around the moored vessel. | Mean transverse loading could fall substantially compared with an empty-quay environment. | The 30–45% figure represents maximum reductions in tested configurations, not a universal harbor correction. |
| Extreme Response | NON-PROPORTIONAL Mean ≠ Extreme | Infrastructure changed turbulence, spectral energy and force-moment relationships. | A lower mean force did not translate into an equally large reduction in extreme response. | Applying a simple shielding percentage to both average and extreme design loads would miss this behavior. |
| Storage-Tank Terminal | DIRECTION-SENSITIVE Yaw Variance Increased | Tank geometry altered low-frequency flow structures at selected wind directions. | The same infrastructure could reduce certain force components while increasing yaw-moment variability. | The paper does not show that tank terminals generally increase yaw loads. The effect occurred at selected tested directions. |
Port Shielding vs. Mean Wind Load
Test how wind speed and a user-selected infrastructure shielding assumption change mean transverse load while keeping extreme response separate.
We welcome your feedback, suggestions, corrections, and ideas for enhancements.
Please click here to get in touch