The $200 Billion Shipyard Problem: Can the U.S. Navy Rebuild Its Yards Before the Fleet Outgrows Them?
🔔 Subscribe to ShipUniverse Weekly →
Growth and Capacity Collide
The Navy is trying to enlarge and modernize its nuclear-powered fleet while simultaneously rebuilding the four government shipyards that keep its submarines and aircraft carriers available for operations. The timelines are beginning to collide.
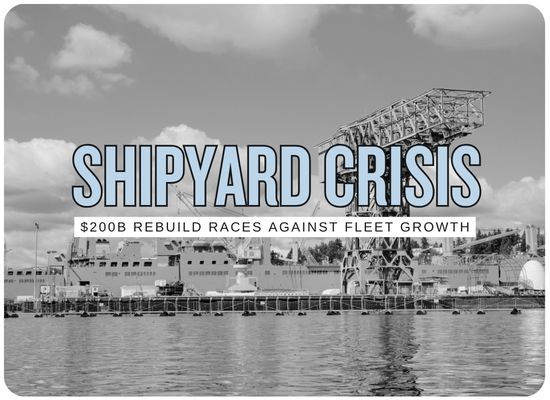
In 2018, the Shipyard Infrastructure Optimization Program was presented as an effort of roughly $21 billion over about 20 years. GAO's September 2026 review now finds that executing the currently planned program will surpass $200 billion and could require more than another 50 years. The final projects in today's plan extend beyond 2080.
That would already be an extraordinary infrastructure problem if maintenance demand were static. It is not. The Navy's May 2026 shipbuilding plan projects an attack-submarine force of 47 boats in fiscal year 2027, 56 by 2040 and 68 by 2056. Meanwhile, GAO says the public yards have completed only about 11 percent of attack-submarine depot maintenance periods on time over the last decade.
The stress test for the Navy is therefore not whether every building, dry dock and utility project can eventually be finished. It is whether enough usable maintenance capacity can arrive early enough to stop today's backlog from colliding with tomorrow's fleet.
$21 billion became more than $200 billion
The two figures should not be treated as a simple apples-to-apples tenfold cost overrun. The original estimate was preliminary and GAO warned years ago that it omitted major costs. Since then the Navy has developed more detailed yard plans, incorporated project escalation and uncertainty, added previously unplanned work, and expanded requirements for utilities, resilience and seismic protection.
The result, however, is operationally more significant than the accounting distinction. SIOP has evolved from a large infrastructure recapitalization program into a multi-generational rebuilding effort whose execution period is longer than the remaining service life of many ships it was originally designed to support.
GAO says the Navy has identified projects ranging from dry docks and waterfront production facilities to utility networks, repair shops, logistics complexes and administrative facilities. Some facilities now being repaired may eventually be demolished or replaced under later SIOP phases, but they must remain functional long enough to support current maintenance work.
The program is now measured in generations
This sequencing creates an unusual planning problem. Ship classes, maintenance concepts, workforce practices and industrial technologies can all change materially before some of the planned facilities are constructed. GAO therefore recommended recurring reviews of SIOP requirements, affordability and readiness rather than treating today's configuration as fixed for the next half-century.
Four facilities carry a mission that cannot simply be moved elsewhere
The public shipyards specialize in depot-level work on nuclear-powered submarines and aircraft carriers. Private yards can perform selected submarine maintenance, but the public yards remain central to nuclear maintenance, refueling, inactivation and other work that cannot be treated as ordinary commercial repair capacity.
Norfolk Naval Shipyard
GAO value of completed, underway and near-term in-design SIOP construction projects as of April 2026. Norfolk supports both nuclear-powered aircraft carrier and submarine maintenance.
Portsmouth Naval Shipyard
Submarine-focused yard undergoing a major Dry Dock 1 expansion designed to support current Virginia-class maintenance requirements.
Pearl Harbor Naval Shipyard
Pacific submarine maintenance hub. A new Virginia-class dry dock is scheduled around the Navy's plan to homeport most of those submarines at Pearl Harbor by 2030.
Puget Sound Naval Shipyard
The largest current SIOP construction portfolio. Puget Sound also performs nuclear ship inactivation, reactor-compartment disposal and recycling work.
GAO counted 140 completed, underway or near-term in-design construction projects across the four yards with a combined final or estimated cost of approximately $33.45 billion. That figure still represents only a portion of the full long-term SIOP program. Capital equipment is separate. As of March 2026, SIOP had procured 385 pieces of equipment worth another $1.49 billion.
Three projects alone approach $22 billion
Dry docks are the most visible part of the capacity problem because a nuclear-powered ship cannot simply be assigned to any open basin. Dimensions, utilities, nuclear support systems, seismic requirements and ship-class compatibility determine whether a dock can actually perform a given availability.
| Yard | Major project | Current authorization / request cited by GAO | Current completion plan | Capacity being created |
|---|---|---|---|---|
| Portsmouth | Dry Dock 1 expansion / two-dock configuration | $2.46B | May 2029 | Virginia-class Blocks I-IV under current project configuration. Navy officials told GAO that future projects are planned for larger Block V boats. |
| Pearl Harbor | New Virginia-class dry dock | $4.47B | March 2029 | Supports Virginia-class maintenance as the class becomes increasingly concentrated in the Pacific. |
| Puget Sound | New dry dock plus major yard reconfiguration | $14.76B | 2038 | Planned for Virginia-class and Ford-class maintenance requirements while meeting seismic-resilience requirements. |
The current estimated total for these three projects is approximately $21.7 billion. The Puget Sound project is particularly consequential because the dry dock cannot be treated as an isolated concrete basin. Existing facilities, piers and shops must be demolished or relocated to make room for it, while maintenance activity continues around the construction zone.
The Navy does not have to wait for a larger fleet to feel the capacity shortage
GAO's August 2026 examination of attack-submarine maintenance found that the Navy's backlog has persisted since fiscal year 2008. Across fiscal years 2016 through 2025, only about 11 percent of attack-submarine depot maintenance periods at public shipyards finished on time.
The direction of the maintenance-duration data is also unfavorable. GAO calculated that average attack-submarine depot periods increased from 744 days during fiscal years 2016-2020 to 809 days during fiscal years 2021-2025.
FY2016-2020
FY2021-2025
Active idle time has improved recently. GAO recorded only 166 active-idle days in fiscal year 2025, far below the 1,518-day peak in fiscal year 2022. A different problem is now building on the retirement side of the fleet.
As older Los Angeles-class submarines leave service, the yards must find dry-dock capacity to defuel their reactors. GAO says that without mitigation, 15 additional attack submarines are projected to enter inactive idle status from fiscal years 2026 through 2030. The associated waiting time could exceed 14,000 days and cost more than $3.1 billion.
USS Pasadena: the capacity problem in one hull
GAO reports that USS Pasadena entered inactive idle status on January 1, 2025 and, under the schedule examined by GAO, was not expected to enter Norfolk Naval Shipyard for decommissioning until November 15, 2028. The submarine would spend 1,414 days waiting because of shipyard capacity constraints, with GAO estimating more than $300 million in operating and support costs during the period.
The workload does not remain at today's level
The May 2026 long-range shipbuilding plan assumes that industrial capacity improves enough to support a significantly larger fleet. Its attack-submarine inventory initially remains constrained as older Los Angeles-class boats retire, but then begins growing during the 2030s.
| Fiscal year | Projected battle-force inventory | Projected attack submarines | Aircraft carriers | Shipyard implication |
|---|---|---|---|---|
| 2027 | 288 | 47 | 11 | Major Portsmouth and Pearl Harbor dry-dock construction remains underway. |
| 2030 | 293 | 45 | 10 | Puget Sound dry-dock construction is currently scheduled to begin. |
| 2040 | 355 | 56 | 11 | Attack-submarine force is about 27% larger than the 44-boat FY2025 fleet examined by GAO. |
| 2056 | 398 | 68 | 10 | Attack-submarine force is roughly 55% larger than the FY2025 force, while SIOP remains unfinished under today's schedule. |
The relevant growth is not the entire battle force. Public nuclear shipyards do not conduct depot maintenance on every destroyer, frigate or auxiliary. The sharper measure is the nuclear workload placed on the four yards, particularly attack submarines, ballistic-missile submarines and aircraft carriers.
GAO counted 44 attack submarines in fiscal year 2025: 20 Los Angeles-class and 24 Virginia-class boats. The Navy's current shipbuilding plan reaches 56 SSNs in 2040 and 68 in 2056. Even before considering changes in maintenance complexity, that represents substantially more hulls cycling through a four-yard nuclear-maintenance system.
The timing mismatch
Rebuilding a shipyard can temporarily make the shipyard harder to use
SIOP is being executed inside active industrial facilities. The Navy cannot empty a yard for ten years, rebuild it and then resume submarine and carrier maintenance. Construction equipment, demolished buildings, temporary utilities, relocated shops, restricted waterfront access and major excavation must coexist with scheduled availabilities.
GAO specifically identified concurrent construction and ship maintenance as a management challenge. Puget Sound provides the clearest example. The future dry dock requires demolition and relocation of existing piers, buildings and maintenance facilities. Some occupants are being shifted to leased off-yard space while other industrial functions must continue.
This produces a capacity curve that is not linear. Money spent on modernization does not automatically translate into additional maintenance throughput in the same year. In some phases, the yard may absorb construction disruption before the completed infrastructure generates an operational benefit.
Concrete does not create skilled labor
Infrastructure capacity and workforce capacity are separate problems. A new dock cannot shorten an overhaul if the required welders, electricians, pipefitters, nuclear-qualified trades, planners, supervisors and material are unavailable at the right time.
Earlier GAO work identified workforce performance and capacity alongside unplanned work as the two principal contributors to carrier and submarine maintenance delays. During fiscal years 2015 through 2019, workforce factors contributed to more than 4,000 days of delay. Some production shops were operating with average overtime of 25 to 32 percent and peaks as high as 45 percent.
The workforce challenge also has a long training tail. During the Navy's earlier hiring surge, public-yard employment rose from approximately 29,400 to 36,700 after attrition, but roughly 56 percent of the production workforce had fewer than five years of experience. Large head-count increases therefore do not immediately translate into equal increases in productive capacity.
The practical constraint is the combination of infrastructure, labor, planning accuracy, material availability and usable dock space. Improving only one element can move the bottleneck somewhere else.
Five capacity levers determine whether the gap widens or closes
Near-term dry docks arrive on schedule
The Portsmouth and Pearl Harbor projects currently target 2029 completion. Their operational value arrives far earlier than later SIOP blocks, making schedule performance on these projects disproportionately important to the near-term capacity picture.
Existing yards increase throughput before the full rebuild
The $200 billion program cannot solve a 2020s maintenance backlog if most productivity benefits arrive decades later. Process improvement, equipment modernization, work sequencing, material availability and workforce proficiency therefore carry much of the burden during the transition.
Selected submarine work shifts outside the public-yard bottleneck
The Navy has previously assigned selected submarine depot work to Electric Boat and Newport News. GAO has also examined wider use of private capacity. The constraint is that private nuclear shipbuilders face their own construction backlogs, workforce shortages and infrastructure limits.
Decommissioning stops consuming scarce operational capacity
Inactive Los Angeles-class submarines waiting for reactor defueling compete for limited nuclear-yard resources. GAO's projected 15 additional inactive-idle submarines through 2030 makes inactivation planning a material part of the capacity equation rather than an administrative end-of-life issue.
SIOP is repeatedly re-baselined against the fleet it will actually serve
GAO found that some SIOP capability requirements approved in 2023 were based on data and operational analysis dating from 2017 through 2022. With projects stretching beyond 2080, periodic reassessment becomes necessary to prevent facilities designed around outdated fleet assumptions from consuming resources decades later.
The size of the fleet alone does not determine the outcome
| Condition | Fleet trend | Effective yard capacity | Likely pressure | Key variable |
|---|---|---|---|---|
| Fleet growth + strong productivity | SSN force grows toward current plan | Dock projects arrive close to schedule and throughput improves | Additional hulls can be absorbed without proportional growth in backlog | Productivity per worker and per dock day |
| Fleet growth + flat productivity | SSN inventory rises during 2030s and 2040s | Physical infrastructure expands but maintenance duration does not materially improve | More hulls compete for a system still operating near today's throughput | Maintenance duration |
| Major SIOP schedule slips | Fleet follows current procurement path | New usable capacity arrives later | Transition-period workload remains concentrated in legacy infrastructure longer than planned | 2029 and 2038 dry-dock milestones |
| Construction remains slower than planned | Fewer new SSNs enter service | Maintenance growth is temporarily moderated | Yard pressure may ease, but because fleet growth itself failed to materialize | Submarine delivery rate |
| Backlog reduction + better inactivation flow | Fleet grows gradually | Existing dry-dock days are used more efficiently | Operational boats face less competition from inactive hulls and waiting periods | Decommissioning throughput |
The fourth case is especially important when interpreting future fleet-versus-yard numbers. If submarine construction remains below plan, the maintenance system may face fewer boats than currently projected. That does not represent additional maintenance capacity. It represents lower demand created by a smaller-than-planned fleet.
U.S. Naval Shipyard Capacity Stress Test
This simplified model converts fleet growth into a maintenance-demand index. It begins with the 44-attack-submarine fleet GAO reported for fiscal year 2025 and asks how much effective maintenance capacity would have to improve simply to keep pace with a larger fleet.
Capacity result
We welcome your feedback, suggestions, corrections, and ideas for enhancements.
Please click here to get in touch