Gulf of Oman’s Floating Oil Hub Hits Its Limit as Saudi Rerouting Drives VLCC Rates to Record
🔔 Subscribe to ShipUniverse Weekly →
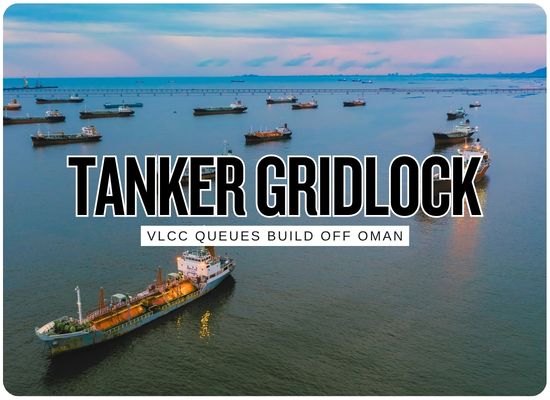
Ship-to-ship crude transfers in the Gulf of Oman have reached practical capacity limits as Saudi Arabia redirects large volumes through the Strait of Hormuz, adding to existing Iraqi and UAE traffic and creating queues for tankers, tugboats, crews and transfer equipment off Oman. Saudi crude exports through Hormuz are on track to reach about 3.6 million barrels per day in September, up from roughly 900,000 bpd in August, while Saudi Aramco has sold more than 60 million barrels for offshore transfer near Sohar during September and October. Kpler estimates that accommodating the roughly 3 million bpd Saudi increase requires 36 to 40 additional VLCCs across the evolving shuttle network. The congestion has helped push the benchmark Middle East-to-China VLCC time-charter rate to a record $1.27 million per day, while individual STS operations are now taking close to 10 days compared with five to seven days previously.
The Oil Keeps Moving. The Floating Transfer System Is Full.
A workaround created to keep Gulf crude moving through the Hormuz crisis has become a major offshore logistics network. Saudi Arabia's sudden shift toward eastern exports has now pushed that network against its practical limits.
Moving the Transfer Point Solves Space but Consumes More Ships
Once the Gulf of Oman is saturated, the next available STS locations are farther from the Gulf. The result is a simple shipping penalty: every extra day in the shuttle loop reduces the amount of crude one VLCC can move each month.
| Routing Option | Round-Trip Shuttle Time | Monthly Capacity per VLCC | VLCCs for ~3 M bpd | Current Advantage | Constraint | Evidence of Use |
|---|---|---|---|---|---|---|
| AT CAPACITY Gulf of Oman Sohar / Fujairah area | ~17 Days Observed Kpler round-trip shuttle cycle. | ~0.12M bpd Monthly export capacity created by each additional VLCC. | ~25 VLCCs If roughly 3 million bpd were handled through this shuttle pattern. | Closest established transfer zone outside Hormuz and therefore the most vessel-efficient offshore option. | Shore-side support, tugs, crews and STS handling capacity at or near practical limits. | Saudi, Iraqi and UAE crude already moving through the system. |
| NEXT RELEASE VALVE West Coast India Vadinar / Kutch / Mumbai area | ~21 Days More than four additional days compared with Gulf of Oman operations. | ~0.09M bpd Lower vessel productivity caused by the longer loop. | ~32 VLCCs Kpler estimate under a full West Coast India STS scenario. | Nearest large alternative once Oman cannot absorb additional transfers. | Greater sailing distance, weather considerations and limited historic role as a major crude redistribution center. | S-Oil is reportedly sending two VLCCs for STS operations off Vadinar. |
| LONG-DISTANCE OPTION Offshore Malaysia Linggi / Pelepas | ~38.5 Days More than twice the Gulf of Oman round-trip cycle. | ~0.05M bpd Less than half the monthly transport contribution of a Gulf of Oman shuttle VLCC. | Up to 58 VLCCs Kpler estimate if roughly 3 million bpd were transferred there. | Established dirty-tanker lightering infrastructure and substantial experience with STS. | Long sailing distances sharply reduce fleet productivity. | Tanker operators report increased crude-transfer activity near Linggi. |
| BYPASS STS Direct Refinery Delivery | Destination Dependent Tanker sails directly from the Gulf to the receiving refinery. | No STS Step Eliminates offshore transfer but commits the vessel for the entire voyage. | More Long-Haul Tonnage Fleet requirement rises as VLCCs remain occupied until discharge and return. | Removes dependence on scarce STS slots, tugs and transfer crews. | More VLCC exposure inside Hormuz and longer round-trip vessel commitment. | Bahri's Gold Shine loaded 2 million barrels at Ras Tanura and sailed directly toward Quanzhou, China. |
STS Bottleneck & VLCC Demand Analyzer
Change the rerouted crude volume and shuttle-cycle assumptions to see how many VLCCs are required if transfers remain in the Gulf of Oman or shift farther east to India or Malaysia.
We welcome your feedback, suggestions, corrections, and ideas for enhancements.
Please click here to get in touch