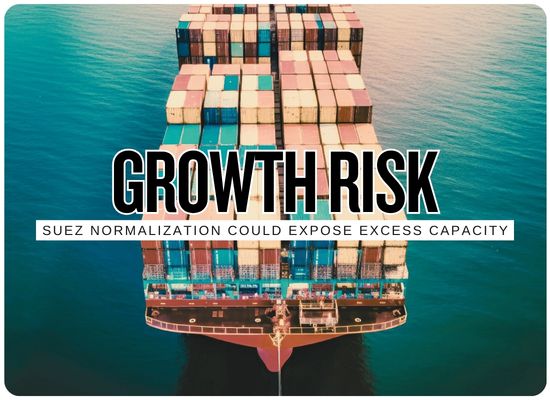
The global containership orderbook has climbed to about 15.6 million TEU across 1,925 ships, equivalent to roughly 45% of the operating fleet, according to Linerlytica, following Maersk's confirmed order for 26 ships of 18,600 TEU and a reported 12-ship, 24,000-TEU order from CMA CGM. BIMCO separately puts the orderbook above 14 million TEU and expects containership fleet capacity to grow 9% in 2027, while effective ship supply is forecast to expand about 5% to 6%, faster than ship demand under both of its Strait of Hormuz scenarios. The imbalance is not yet visible as widespread idle tonnage: only about 0.6% of the fleet was commercially inactive in late August, while Cape of Good Hope diversions and port congestion continue to absorb millions of TEU of capacity.
Container Capacity Watch · September 2026
The Industry Has 15.6 Million TEU Waiting in the Shipyard Pipeline
45%
orderbook relative to today's fleet
The operating fleet is already close to 34.7 million TEU. Another 15.6 million TEU is now reported on order, creating the largest orderbook-to-fleet ratio since the aftermath of the 2008 shipping boom.
Existing Fleet + Orderbook
This is not a forecast that every ordered ship will add net capacity. Some vessels will replace older tonnage, but recycling has remained exceptionally low.
34.7M TEU Fleet
15.6M
Operating capacityOrderbook = ~45%
Post-2009 high
Linerlytica says the current ratio has moved above 45%. The orderbook stood at only 7.6 million TEU at the post-Covid peak in August 2023.
Ships Currently On Order
1,925
Linerlytica's latest tally following the newest large-vessel contracting.
2027 Fleet Capacity Growth
+9%
BIMCO forecast as the delivery schedule accelerates.
Jan-Jul 2026 Container Volume
+5.1%
Strong trade growth has helped absorb new capacity so far this year.
Commercially Idle Fleet
0.6%
Only about 95 containerships were inactive in Alphaliner's late-August survey.
Recycled in 5½ Years
<300K TEU
Fleet removals have been tiny compared with the 10 million TEU added since early 2021.
Today's tight market is hiding tomorrow's spare capacity
Ships are currently being absorbed by longer Cape voyages, congestion, disrupted Gulf services and slower operations. If those frictions unwind while newbuild deliveries accelerate, the same fleet can suddenly transport substantially more cargo.
3.5M TEU
Still on Cape diversions
About 250 ships remain diverted around Africa, down from a peak of roughly 380 ships and 5.4 million TEU earlier in 2026.
>11%
Fleet absorbed by congestion
Linerlytica estimates global port congestion is still tying up more than one-tenth of containership capacity.
The 2027 Capacity Equation
The Problem Is Not Only New Ships
A large part of today's fleet is being consumed by inefficient routing and disruption. The supply shock becomes much larger if new ships arrive at the same time that those inefficiencies disappear.
Capacity Being Absorbed Today
These forces are helping keep ships employed even while the fleet continues to expand.
Cape of Good Hope Diversions3.5M TEU
Around 250 ships remain on the longer Cape routing, according to Linerlytica.
Port Congestion>11%
More than one-tenth of fleet capacity remains tied up by congestion and waiting time globally.
Persian Gulf DisruptionOngoing
Severely reduced Hormuz container traffic is distorting Gulf networks and vessel positioning.
Slower SailingSupportive
BIMCO expects lower average speeds to continue helping absorb vessel supply into 2027.
Balance
⇄
Effective ship demand
Capacity That Could Return
Normalization can release ships without one additional newbuilding entering service.
Suez ReturnUp to -10%
BIMCO estimates fully normalized Suez routing could leave ship demand about 10% lower than if Cape diversions continue.
2027 Fleet Expansion+9%
Physical fleet capacity is scheduled to rise sharply as the delivery pipeline accelerates.
Congestion EasingPotentially Large
Clearing queues converts currently occupied vessels back into usable network capacity.
RecyclingOnly 140K TEU
BIMCO's outlook assumes comparatively modest vessel removals despite a large stock of older ships.
BIMCO's 2027 Supply-Demand Range
Ship SupplyBoth Hormuz scenarios
Effective supply growth~5% to 6%
Physical fleet growth~9%
DirectionAccelerating
Hormuz OpenNormal traffic resumes
Ship-demand growth2.5% to 4.5%
SupplyStill faster
Economic dragLower
Hormuz ClosedEnergy disruption persists
Ship-demand growth0.5% to 2.5%
SupplyMuch faster
Economic dragHigher
Current Cape Diversion
250 Ships / 3.5M TEU
Longer voyages require more vessels to maintain weekly service frequency.
→
Normalized Suez Network
Fewer Ships Needed
BIMCO estimates full normalization could reduce ship demand by about 10% relative to continued Cape routing.
Strong freight rates do not disprove the supply risk.
Current container rates are being supported by war-related fuel costs, chokepoint disruption, congestion and seasonal demand. Those conditions can coexist with a large structural orderbook because they temporarily reduce effective vessel supply.
Ship Universe Container Capacity Tool
2027 Overcapacity Stress Test
Test the balance between fleet growth and effective ship demand, then model how much capacity a return to shorter Suez routings could release.
M TEU
%
BIMCO currently models approximately 5% to 6%.
%
Enter the growth you expect before any route-normalization effect.
%
Models the reduction in ships required when shorter routing returns. BIMCO says full normalization could reduce ship demand about 10% relative to continued Cape routing.
Orderbook / Fleet
45.0%
entered orderbook relative to current fleet
Orderbook Less Recycling
15.46M
simple pipeline comparison after entered recycling
Effective Capacity vs Ship Demand
Both bars start from today's fleet size. The difference represents the modeled balance under your assumptions.
Effective Supply36.61M TEU
Ship Demand35.91M TEU
Selected Scenario
Cape Routing Persists
Change the assumptions to test how quickly the balance moves if fleet growth accelerates, cargo demand weakens or additional Asia-Europe services return through Suez.
Supply Growth5.5%
Base Demand3.5%
Suez Release0%
Orderbook15.6M
Scenario methodology:
The tool is not a freight-rate forecast. Effective supply growth is entered separately from physical fleet growth because speed, congestion, off-hire and deployment patterns change how much fleet capacity is actually available. The Suez adjustment reduces the modeled level of ship demand rather than cargo volume because a shorter route allows the same cargo to move with fewer ships.
Feedback Welcome
We welcome your feedback, suggestions, corrections, and ideas for enhancements.