Maersk Raises 2026 Outlook Again as Strong Container Demand, Higher Rates and Port Congestion Lift Profit
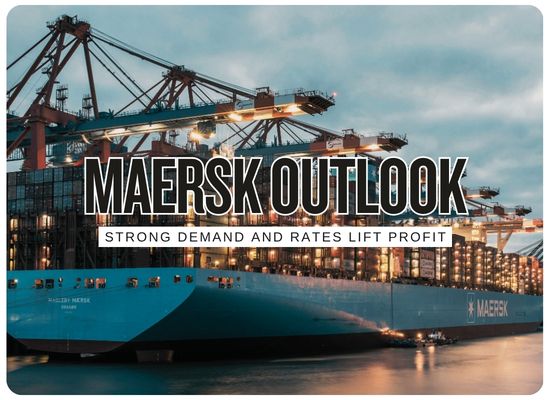
A.P. Moller-Maersk has raised its 2026 earnings outlook for the second time this year after stronger container demand, higher freight rates and widespread port congestion drove second-quarter results above expectations. Maersk reported quarterly EBITDA of about $3.0 billion, up from $2.3 billion a year earlier and well above the $2.12 billion analyst consensus, while quarterly revenue rose to roughly $15.8 billion and net profit reached about $1.26 billion. The company now expects underlying EBITDA of $10.5 billion to $12.5 billion for 2026, compared with its previous $8 billion to $10 billion range. Strong Chinese exports helped offset a roughly 40% contraction in Middle East container imports, while congestion at major ports has reduced effective shipping capacity and supported freight rates despite substantially higher bunker and operating costs.
Container Market Impact Snapshot
Maersk's latest results show a container market in which strong cargo demand and severe infrastructure bottlenecks are tightening effective capacity faster than higher fuel and disruption costs are eroding earnings.
The range has been lifted from $8 billion to $10 billion and is more than double the midpoint of Maersk's original February outlook.
Quarterly earnings substantially exceeded the approximately $2.12 billion analyst consensus.
Stronger Ocean pricing and volume helped push consolidated revenue sharply above the comparable quarter.
Maersk continues to expect global container demand growth of roughly 4% for the full year.
Maersk's CEO cited severe Shanghai queues as one example of infrastructure congestion reducing effective vessel capacity.
Container Market Profit Drivers
Maersk's earnings upgrade reflects a combination of stronger cargo volumes, constrained effective vessel capacity, higher spot pricing and a global network that remains far from normalized.
| Market Driver | Latest Reading | Freight Rate Effect | Operational Effect | Potential Reversal | Signal to Watch |
|---|---|---|---|---|---|
| Chinese Export Demand |
STRONG Export volumes remained a major source of global container growth in Q2. |
Supports utilization and gives carriers greater pricing power on major outbound Asia trades. | High origin volumes place pressure on equipment, terminals, feeder networks and vessel schedules. | Tariffs, inventory normalization or weaker consumer demand could reduce export momentum. | China-to-Europe and China-to-North America booking volumes through Q3. |
| Port Congestion |
UP TO 12 DAYS Shanghai berth waits cited by Maersk CEO Vincent Clerc. |
Removes effective vessel capacity and can support higher spot rates even without a physical shortage of ships. | Vessel queues, missed berthing windows, bunching and equipment imbalances spread through the network. | Faster terminal productivity or weaker cargo volumes would release capacity. | Average waiting time at Shanghai, Northern European and African gateway ports. |
| Global Container Demand |
~4% GROWTH Maersk's current full-year 2026 market estimate. |
Sustained volume growth improves utilization across the liner fleet. | More cargo increases pressure on ports, inland logistics, container equipment and transshipment hubs. | A global slowdown would weaken utilization and expose the industry's underlying fleet growth. | Global loaded container volumes and Asia-origin trade growth. |
| Suez Return |
GRADUAL Roughly one-third of Maersk's normal traffic is again using the corridor. |
A full return could release vessel capacity because Asia-Europe voyages become shorter. | Maersk is deliberately phasing the return to avoid creating additional terminal disruption. | Renewed Red Sea security deterioration could send vessels back around Africa. | Number of Gemini and Maersk services permanently restored through Suez. |
| Bunker Costs |
+44% YOY Average bunker price compared with Q2 2025. |
Encourages higher surcharges but increases the operating break-even level for each sailing. | Fuel optimization, slow steaming and voyage planning become more economically important. | Lower oil prices could rapidly reduce the fuel-cost pressure. | LSFO pricing and carrier fuel-surcharge announcements. |
| Middle East Imports |
-40% Regional import contraction during Q2. |
Weakens pricing on affected regional trades but has not outweighed global demand strength. | Services, equipment and capacity have to be repositioned as regional flows change. | Normalization of Gulf trade could restore significant regional cargo volumes. | Arabian Gulf and Red Sea import volumes. |
| Global Infrastructure |
CAPACITY CONSTRAINT Maersk cites bottlenecks in Europe, South America, West Africa and China. |
Persistent landside congestion can support ocean pricing even as carriers add new ships. | Terminal, truck, rail and depot constraints increasingly determine end-to-end vessel productivity. | Infrastructure investment or lower volume growth would reduce congestion. | Port dwell time, rail congestion and terminal utilization. |
Freight Rate Increase Profit Sensitivity Calculator
Model how a freight-rate increase can interact with higher bunker, congestion and operating costs across a container-shipping volume. The calculator uses user-entered scenarios rather than Maersk financial guidance.
We welcome your feedback, suggestions, corrections, and ideas for enhancements.
Please click here to get in touch