The $345 Million Price of Winning a Megaship
🔔 Subscribe to ShipUniverse Weekly →
Major ports increasingly need nine-figure terminal, berth, parking, baggage, biometric, shore-power and road infrastructure
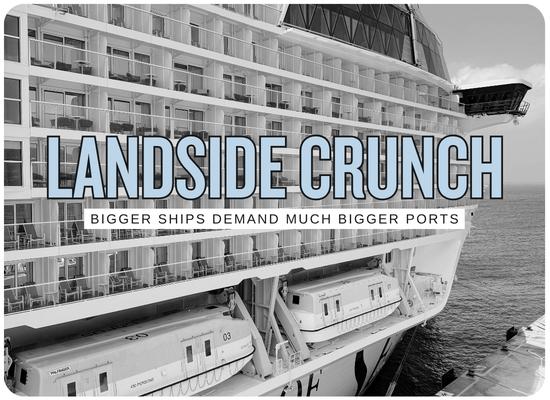
The next generation of cruise ships is creating a second megaproject on shore.
A port that wants a 6,000 or 7,000-passenger ship may need far more than a berth long enough to hold it. The ship can trigger a new terminal, parking garage, baggage plant, biometric processing system, security lanes, passenger bridges, shore power, roads, ground transportation areas and new marine infrastructure.
Galveston has already spent hundreds of millions building for larger ships and is now negotiating another Royal Caribbean terminal for Icon-class capacity. Miami is building a $345 million terminal specifically around the same scale.
Cruise ship capacity has traditionally been described in naval-architecture terms: gross tonnage, length, beam, draft and passenger berths.
For the homeport, one of the hardest numbers is now passengers per turnaround. Thousands of people leave the ship while thousands more arrive, luggage moves in both directions, parking spaces turn over, rideshare vehicles queue, provisioning trucks arrive and the vessel may simultaneously require megawatts of shoreside electrical power.
The ship leaves a few hours later. The expensive infrastructure stays behind for decades and must earn its return one turnaround at a time.
Bigger system.
The berth is only the waterfront edge of the project
The most expensive modern cruise developments increasingly resemble an airport terminal connected to a marine berth.
Building capacity for the ship means simultaneously building capacity for people, bags, automobiles, buses, electrical load, security processing and provisioning.
That is why a cruise-development announcement that sounds like a terminal project can become a nine-figure transportation and utility project.
Galveston is already on its third expansion cycle
Another terminal is being negotiated
Royal Caribbean Group and the Galveston Wharves are negotiating development, financing, construction and operating terms for a fifth terminal intended to accommodate an Icon-class ship.
As of October 2026, the final capital cost and commercial agreement have not been announced.
The capital escalation can be seen in three Galveston terminals
Approximately 161,000 square feet, Oasis-class berth capability, passenger bridge, parking, roadway and utility work, mobile check-in and facial recognition.
165,000-square-foot terminal, seven-story garage, surface parking, passenger bridges, marine upgrades, internal roadways and ground transportation.
Proposed Royal Caribbean facility for Icon-class deployment with terminal, berth and surrounding mobility infrastructure still being negotiated.
The cost is rising even when an existing building can be reused
Cruise Terminal 16 did not begin as an empty greenfield site. Galveston converted older cargo buildings into the new terminal and retained about 85% of the existing structural elements.
The finished complex still cost $156 million because the investment extended far beyond the building shell.
A 7,000-passenger ship creates a 14,000-person turnaround
If a fully loaded ship disembarks 7,000 guests and replaces them with another 7,000 on the same turnaround day, passenger capacity effectively passes through the terminal twice.
Passenger and baggage throughput figures above are ShipUniverse scenario calculations, not reported performance standards for any specific terminal. Seattle reports that an average homeport call takes about 10 hours to offload passengers, load provisions, embark new guests and prepare the ship for departure.
The modern cruise terminal is eight infrastructure projects at once
Berth
Berth length, draft, dredging, mooring dolphins, bollards, fenders and structural loads must fit the vessel.
Terminal
Check-in, waiting, customs, security, elevators, escalators and passenger bridges scale with peak turnover rather than annual averages.
Luggage Plant
Thousands of bags have to move between curbside, security screening, staging areas and ship within a few hours.
Biometrics
Facial verification, digital identity and automated gates become throughput infrastructure rather than optional passenger technology.
Garages
Drive-to homeports can require thousands of structured spaces beside the cruise terminal.
Roads
Embarkation traffic, disembarkation traffic, buses, taxis and rideshare vehicles overlap during the same peak period.
Shore Power
Grid connection, transformers, converters, switchgear and cable-management systems can add another major capital project.
Provisioning
Trucks loading food, hotel supplies, waste handling and ship services must operate without colliding with passenger flows.
Parking alone can become a $50 million to $100 million project
One parking garage
Port Canaveral's new Cruise Terminal 6 East garage adds roughly 3,700 spaces and is the largest parking project in the port's history.
It is being built because more than 80% of Port Canaveral cruise guests arrive by car.
A drive-to cruise market creates its own land problem
At $93 million for roughly 3,700 spaces, Port Canaveral's project represents about $25,000 of construction investment per parking space on a simple project-cost basis.
Galveston's Terminal 16 garage cost about $55 million for more than 1,600 spaces. Structured parking is expensive, but using valuable waterfront acreage for large surface lots creates its own economic cost.
The baggage system is becoming an industrial plant
Luggage screeners
Screening machines installed in MSC's Miami mega-terminal.
Guests per day
Maximum daily passenger-processing capacity across three ships.
Terminal area
Four-level MSC Terminal AA complex at PortMiami.
Garage spaces
Structured parking immediately adjacent to the terminal.
Biometrics are now capacity infrastructure
MSC's Miami terminal demonstrates how technology is being used to avoid simply making every passenger-processing room larger.
Home Check-In
Travel documents and boarding information are completed before arrival.
Bag Drop
Checked-in passengers can leave luggage at secure drop points in the garage.
18 Face Pods
Opt-in passengers use biometric identity verification rather than conventional counter processing.
20 Security Lanes
Security capacity is built for peak simultaneous demand.
22 E-Gates
Embarkation is finalized in the terminal before passengers move onto the ship.
A faster terminal can substitute technology for floor area
The design problem is not simply how many passengers fit inside the building. It is how quickly each passenger can move through the building.
A biometric lane that shortens processing time increases effective terminal throughput without adding another waiting hall. The technology therefore has an infrastructure value as well as a guest-experience value.
Recent projects show the new capital range
| Project | Capital | Ship / Passenger Scale | Main Scope | Infrastructure Signal |
|---|---|---|---|---|
| Galveston Terminal 10 | $125M | Oasis class / up to 6,780 guests on original anchor ship | Terminal, pier improvements, parking, roadways, passenger bridge, biometrics and utilities | PURPOSE BUILT |
| Galveston Terminal 16 | $156M | Designed around approximately 5,500-passenger vessel scale | Terminal conversion, berth work, two bridges, $55M garage, surface parking and roadways | FULL COMPLEX |
| Port Canaveral CT5 + CT6 Garage | ≈$171M | Terminal designed for ships up to roughly 5,600 passengers | $78M terminal expansion plus $93M, 3,700-space garage | LANDSIDE SCALE |
| Port Canaveral CT10 | $95M | Up to 7,000 passengers | Terminal enlargement, luggage, security, vertical circulation, HVAC and passenger areas | MAJOR RETROFIT |
| PortMiami Terminal G | $345M | Up to 7,000 passengers / Icon-class support | Terminal, multi-level garage, intermodal hub and associated infrastructure | MEGAPROJECT |
| MSC Miami Terminal AA | ≈$350M announced investment | Three ships / up to 36,000 guests daily | 492,678-ft² terminal, garage, baggage plant, biometrics, three berths and shore-power capability | MULTI-SHIP HUB |
| PortMiami Shore Power | ≈$125M | Five cruise berths | Electrical connections allowing ships to shut down onboard generation at berth | ENERGY LAYER |
| Seattle Pier 66 Shore Power | $44M | Completes shore power across three Seattle cruise berths | Grid connection including submarine cable and berth equipment | GRID PROJECT |
| Seattle 2026 Expansion | $116M | Piers 66 and 91 | Additional shore-power outlets during off-season infrastructure work | POWER EXPANSION |
| Southampton Horizon | £55M+ | Next-generation large cruise ships | New terminal with rooftop solar and shore-power readiness | EUROPEAN MODEL |
Nine figures is not a universal terminal price
A smaller vessel, an existing berth, available surface parking and adequate electrical capacity can dramatically reduce the required investment.
The pattern appears at the upper end of the market. Once a port wants to accommodate today's largest homeported ships at high passenger volumes, the project often expands beyond a terminal building into several expensive infrastructure systems.
Shore power creates another capital layer after the terminal is finished
PortMiami shore-power program
Miami developed shore-power capability across five cruise berths at an originally stated program cost of roughly $25 million per terminal.
The port currently says three ships can connect simultaneously.
The berth becomes part of the electrical grid
A large cruise ship still needs power when propulsion is stopped. Lighting, refrigeration, HVAC, restaurants, elevators, pumps and hotel services continue operating.
Supplying that load from land may require utility feeders, substations, switchgear, frequency conversion, transformers, cable management and redundancy.
In Europe the pressure is becoming regulatory as well as environmental. FuelEU Maritime requires covered passenger vessels to use shoreside electricity at qualifying EU ports beginning in 2030.
Traffic can become the constraint before the berth does
Galveston's proposed fifth terminal is now being planned alongside a city-port mobility study because another cruise berth also means another traffic peak.
Port planning specifically lists traffic flow, parking, utilities, marine infrastructure and driveways among the variables that have to be coordinated between Pier 14 and the surrounding waterfront.
The first phase of the mobility work includes traffic counts at more than 40 intersections. The port has also invested in an internal road system intended to keep cruise traffic from spilling unnecessarily onto surrounding streets.
The next ship can force investment miles away from the gangway
Terminal + Berth
The visible infrastructure handles the vessel, passenger screening, baggage and embarkation.
Parking + Roads
Drive-to traffic creates garage capacity, circulation roads, crossings, signals and rideshare staging.
Grid + Transport
Electrical utilities, bridges, highways, airports and urban streets can all feel the effect of higher cruise capacity.
A $345 million terminal has to earn its way back
The following is not PortMiami's financing structure. It simply illustrates the capital burden of a nine-figure facility by amortizing project cost over 30 years at an illustrative 5% interest rate.
This helps explain why modern cruise terminals are often tied to long-term operating agreements rather than built speculatively.
PortMiami's Terminal G agreement is expected to increase Royal Caribbean Group passenger movements over time and has been described by Miami-Dade as producing a roughly $2.5 billion positive fiscal impact over the agreement horizon.
Galveston's Terminal 16 was similarly supported by long-term agreements with MSC and Norwegian, allowing the port to finance the project through cash reserves and revenue bonds.
The cruise line is increasingly part of the port-financing model
Galveston's Pier 10 was developed through a public-private partnership with Royal Caribbean. Terminal 16 was underwritten by long-term operating commitments. PortMiami's Terminal G combines Miami-Dade and Royal Caribbean Group funding.
The vessel deployment commitment is therefore not only an operating decision. It can become part of the infrastructure's credit story.
The next generation of ships is changing port competition
| Capability | Old Question | Megaship Question | Capital Consequence |
|---|---|---|---|
| Berth | Can the ship fit? | Can the berth handle ship size, mooring loads and next-generation passenger bridges? | Marine construction, fenders, bollards, dredging and structural work |
| Terminal | Is there enough waiting room? | Can thousands disembark while thousands more arrive? | Much larger baggage, security and circulation spaces |
| Parking | Is parking nearby? | Can thousands of spaces turn over in a few hours? | Multi-level garages and digital parking systems |
| Roads | Can passengers reach the port? | Can traffic peaks be contained without damaging the surrounding city? | Internal roads, signals, intersections and ground-transport staging |
| Security | Can guests be screened? | Can they be screened without producing a multi-hour queue? | More lanes, automation, biometrics and digital identity |
| Baggage | Can luggage reach the ship? | Can tens of thousands of bags be screened and moved in one turnover? | Industrial-scale luggage screening and staging |
| Power | Can the terminal be powered? | Can the terminal and the ship draw power simultaneously? | Substations, feeders, transformers, converters and berth connections |
The infrastructure risk works in both directions
Build too little and the port may be unable to attract the largest or most commercially valuable ships.
Build too much and hundreds of millions of dollars can sit underutilized if cruise deployment changes, passenger growth slows or ships migrate to another region.
That is why long contracts, minimum passenger commitments, parking revenue and public-private financing have become as important as the terminal architecture.
What does a 7,000-passenger ship do to the port?
Change the ship, traffic and infrastructure assumptions below. The model estimates same-day passenger movements, baggage volume, vehicle demand, parking requirements, project capital and annual capital recovery.
Scenario model only. It is not an estimate for the proposed Galveston Pier 14 terminal, PortMiami Terminal G or any other specific project. Real project costs depend on land, existing structures, dredging, berth condition, terminal design, utility capacity, parking strategy, environmental mitigation, labor, permitting, financing and local construction costs. Passenger and baggage throughput assume a complete same-day turnover of the entered passenger load. Vehicle demand assumes the entered drive share and vehicle occupancy. Parking-space demand applies the entered parking share only to the embarking passenger load. Capital recovery uses a standard amortizing-payment model and excludes operating expense, reserve requirements, tax treatment and financing fees.
Research basis
- Port of Galveston August and October 2026 announcements covering negotiations with Royal Caribbean Group for a fifth terminal at Pier 14.
- Port of Galveston project reporting covering the $125 million Cruise Terminal 10 development, parking, roadway, pier and biometric systems.
- Port of Galveston reporting covering the $156 million Cruise Terminal 16 complex, garage, roadways, passenger bridges and marine infrastructure.
- Port of Galveston 2026 mobility-study reporting covering traffic analysis and more than 40 intersections.
- Miami-Dade County January 2026 Terminal G groundbreaking and capital documentation covering the $345 million project and 7,000-passenger design capacity.
- MSC Cruises and MSC Group reporting on PortMiami Terminal AA, including terminal size, passenger throughput, parking, luggage screening and biometric systems.
- Port Canaveral 2026 capital-project reporting covering the $78 million Cruise Terminal 5 expansion, $93 million CT6 East parking garage and $95 million Cruise Terminal 10 project.
- PortMiami Shore Power Program reporting covering five cruise berths and approximately $125 million of initial program investment.
- Port of Seattle reporting covering its $44 million Pier 66 shore-power project, three shore-powered cruise berths and planned 2026 expansion.
- Associated British Ports reporting covering Southampton's £55 million Horizon Cruise Terminal and associated shore-power investment.
- European Commission FuelEU Maritime and Alternative Fuels Infrastructure Regulation guidance covering passenger-ship shore-power requirements beginning in 2030.
- Royal Caribbean Icon of the Seas technical fact sheet for vessel scale, passenger capacity and crew complement.
We welcome your feedback, suggestions, corrections, and ideas for enhancements.
Please click here to get in touch