Strait of Hormuz Update: Oil Flows Recover Toward 80–90%, but Tanker Attacks and LNG Collapse Keep Route Far From Normal
🔔 Subscribe to ShipUniverse Weekly →
Oil movements through the Strait of Hormuz have recovered sharply from the collapse seen earlier in the Iran war, with ship-tracking firms now estimating crude flows at roughly 80%–90% of pre-war levels. The recovery remains highly unstable: Kpler measured flows falling to about 10.1 million barrels per day after the latest wave of tanker attacks, at least 12 attacks or attempted attacks were recorded around Hormuz during the week of September 28–October 5, and UKMTO has logged additional tanker strikes through October 11. Qatar's LNG trade remains far further from normal than crude, with September exports of 1.6 million tonnes still below one-quarter of pre-war levels and October exports tracking at only about 0.6 million tonnes. Iran, meanwhile, said October 12 that it is still reviewing the U.S. response to Tehran's seven-condition proposal for formally reopening the waterway and restoring maritime security.
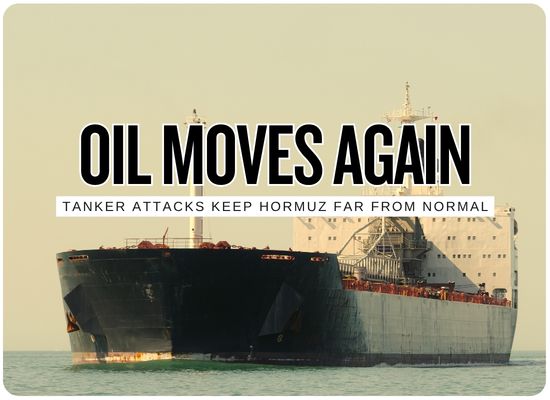
Oil is moving again. Safe, predictable shipping has not returned.
Crude flows have recovered surprisingly far despite repeated tanker attacks, while LNG, visible ship traffic and maritime confidence remain deeply impaired.
One strait, two very different recoveries
Oil can use storage, larger tanker pools, ship-to-ship transfer chains and alternative export systems. LNG requires a tightly synchronized chain from gas field to liquefaction train to specialized carrier.
Crude & Oil Products
Gulf producers have restored a large share of crude exports through protected Hormuz transits while simultaneously expanding exports through the Gulf of Oman and Red Sea.
Qatar LNG
Qatar's October exports are tracking near 0.6 million tonnes after September's 1.6 million tonnes. Reliable passage remains too uncertain for normal LNG-chain operation.
UKMTO recorded additional tanker strikes in and around Hormuz on October 10 and 11.
Iran is reviewing Washington's response to its seven-condition reopening proposal.
Gulf of Oman coast and Red Sea crude exports recently rose to more than twice pre-war levels.
OPEC and non-OPEC ministers say shipping and insurance can now exceed one-third of energy cargo value.
Hormuz Operating Status: October 13
| Layer | Latest Position | Key Number | Change / Context | Operational Meaning | Status |
|---|---|---|---|---|---|
| Oil Through Hormuz | Large-scale crude movements have resumed despite the continuing conflict. | ≈80–90% of pre-war flow in recent tracking estimates. | September crude movements reached around 16M bpd before another attack-driven pullback. | The strait can move very large volumes when tanker operators are willing to accept the security and insurance risk. | Strong Recovery |
| Daily Volatility | Flow recovery has not been smooth. | 10.1M bpd Kpler reading after the latest attack wave. | Down 27% from the wartime weekly high and around 74% of Kpler's pre-war benchmark. | One cluster of attacks can rapidly change owner willingness to transit. | Highly Volatile |
| Visible Vessel Traffic | AIS-visible commercial crossings remain thin. | 7 / 24h on one live AIS tracker early October 13. | Some tankers transit without normal AIS visibility, so the true count is higher. | Cargo volume and visible vessel count no longer move together in a normal relationship. | Abnormal Traffic |
| Tanker Security | Projectile strikes, harassment, surveillance and hailing continue. | 12+ incidents Sept. 28–Oct. 5. | Highest weekly attack count since the war began. | Owners must price physical loss, crew exposure, off-hire and potential vessel entrapment into each transit. | Severe Risk |
| Latest UKMTO Reports | Tanker attacks continued through October 11. | Oct. 10–11 additional incidents in Hormuz and near Sohar. | At least one outbound tanker suffered hull damage; crews were reported safe in the October 11 Hormuz incident. | No sustained security normalization is visible yet. | Ongoing Attacks |
| Qatar LNG | LNG recovery remains dramatically behind oil. | 0.6M t October export pace estimated by Kpler. | September reached 1.6M tonnes, still below one-quarter of normal. | Occasional tanker passage is insufficient for a continuously operating LNG production and export chain. | Deeply Disrupted |
| Iran–U.S. Talks | Tehran is reviewing Washington's response to its proposal. | 7 conditions cited by Iran for formal reopening and resumed talks. | Iran says the U.S. response has not sufficiently addressed the conditions. | No durable maritime-security framework has been agreed. | Stalled |
| Alternative Crude Routes | Gulf producers are using non-Hormuz outlets at unprecedented scale. | 6.7M bpd Gulf of Oman coast + Red Sea exports. | More than twice pre-war levels in Kpler's October 6 assessment. | Alternative outlets are now an integral part of the export system, not simply emergency backup. | High Utilization |
| Saudi Bypass Expansion | Riyadh plans another major increase in pipeline flexibility. | +1.2M bpd possible within 7–8 weeks. | Longer-term investment could add up to 3M bpd and take diversion capability toward 10M bpd. | Hormuz dependency is now becoming a long-term infrastructure issue. | Expansion Planned |
| Shipping Economics | Freight, insurance and routing inefficiency remain extreme. | >⅓ cargo value shipping + insurance in some energy movements. | VLCC spot earnings have exceeded $800K/day globally and some routes approached $40/bbl freight. | Restored barrels do not mean restored economics. | Exceptional Cost |
Cabinet-approved legislation would compensate importers for higher transport costs on alternative routes and backstop some marine insurance.
Riyadh says pipeline and infrastructure investment could eventually raise crude-export diversion capability toward 10 million bpd.
Governments and producers are now spending money to make future energy trade less dependent on one maritime chokepoint.
Hormuz Energy Exposure & Bypass Model
Test how much oil remains exposed to Hormuz under different flow-recovery assumptions and how alternative export routes change the regional picture.
Even at 85% recovery, nearly 18 million barrels per day remains physically exposed to the Hormuz security environment.
We welcome your feedback, suggestions, corrections, and ideas for enhancements.
Please click here to get in touch