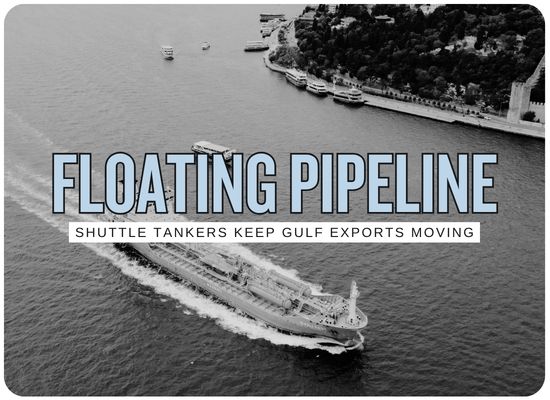
Why Tanker Attacks Are No Longer Stopping Gulf Oil
Middle East crude exports have climbed back to pre-war territory while
merchant ships are still being struck inside the world's most important
oil chokepoint. The explanation is not that Hormuz became safe. The
export system has been rebuilt around the danger.
Seven-day moving average for regional crude exports on September 30.
Risk signal
7+
Tanker incidents reported during the latest attack cluster.
Important distinction: 18.3 million bpd is the region's total export
flow across Hormuz, Red Sea routes and terminals outside the Strait.
It is not a Strait-only throughput figure.
Normally, rising attacks on tankers should reduce traffic. September
produced the opposite result. Middle East crude exports moved above their
pre-war benchmark on 14 days while a growing number of vessels continued
to cross Hormuz.
The contradiction disappears once the trade is separated into its
components. Pipelines move a much larger share around the Strait.
Tankers that do cross often operate as dedicated shuttles. Their cargoes
are handed to other vessels outside the high-risk zone. Direct voyages
are increasing as transfer hubs fill, and some tankers cross with tracking
systems switched off.
The result is a resilient but expensive logistics machine. It can move
almost normal volumes while individual ships remain exposed to abnormal
physical risk. Its real constraint is therefore not simply whether
another tanker is hit. It is whether one of the supporting layers loses
enough capacity that the remaining layers can no longer absorb the flow.
First separate the numbers
Regional exports and Hormuz throughput are not the same metric
Regional crude exports
18.3M bpd
Kpler seven-day moving average on September 30 across multiple
Middle East export routes.
Strait crude-flow snapshot
14.2M bpd
Seven-day average through Hormuz on September 26, nearly 80% of
pre-war Strait crude flow.
Pre-war regional average
~18.0M bpd
Average crude exports during the 12 months before the war.
Above pre-war benchmark
14 days
September days on which regional export volumes exceeded the
pre-war benchmark.
The Strait figure may initially undercount real traffic.
Kpler says vessels often disable AIS while crossing and sometimes remain
dark for several days afterward, meaning recent flow estimates can be
revised upward once voyages are reconstructed.
The new export architecture
Forty percent of non-Iranian Gulf crude now leaves without crossing Hormuz
Kpler's September route reconstruction for Middle East Gulf exports
excluding Iran.
Where the crude exits
One oil region now operates through three major gateways
Hormuz
60%
Outside Strait
23%
Red Sea
17%
The outside-Strait category is led by pipeline-fed loadings on the
Gulf of Oman coast, especially Fujairah. Red Sea volumes primarily
rely on Saudi Arabia's East-West pipeline and western export system.
Before the war
83%
Approximate share of regional crude that crossed Hormuz.
September
60%
The same export system now depends much more heavily on bypass routes.
How higher flow became possible
The industry built a multi-layer logistics system around the conflict
Layer 1
Pipelines
Move barrels around the Strait before a tanker is needed
Saudi Arabia's East-West system sends crude toward Yanbu while the
UAE's pipeline supplies Fujairah on the Gulf of Oman coast.
Layer 2
Shuttle VLCCs
Keep the high-risk transit short
Dedicated vessels load inside the Gulf, cross the Strait and return
after handing their cargo to another tanker outside the highest-risk area.
Layer 3
Offshore STS
Transfer the crude to vessels that do not need to enter the Gulf
In August, more than 70% of crude that crossed Hormuz later changed
tankers offshore near Fujairah or Sohar.
Layer 4
Protected transit
Concentrate the crossing into a managed corridor
Reuters has reported tankers using a narrow Omani coastal corridor
with U.S. naval protection while many ships keep AIS switched off.
Layer 5
Direct voyages
Skip the local transfer hub when the transfer system is full
Iraqi and Saudi cargoes are increasingly using direct Asian voyages
or more distant transfer areas as Gulf of Oman support capacity tightens.
The floating pipeline
At least 63 VLCCs are now part of the shuttle architecture
Kpler September fleet estimate
Hormuz is increasingly operating like a tanker conveyor belt
Shuttle VLCC pool
63+
Identified by Kpler by late September.
Typical round trip
~16 days
Approximate turnaround for the dedicated shuttle trade.
Implied capacity
~7.6M bpd
Kpler estimate for the identified shuttle pool.
The fleet is not the only bottleneck.
Kpler says Fujairah and Sohar transfer infrastructure is at or close
to capacity. Tugs, fenders, hoses, crews and safe anchorage can become
limiting factors before the global VLCC fleet itself runs out.
Risk did not disappear
Seven attack reports arrived in a five-day cluster
UKMTO attack advisories #144 through #150.
Recent attack cadence
Rising traffic has coincided with repeated projectile strikes
Sep 29–30
3
Three separate commercial-vessel attack reports were recorded,
with UKMTO advisories issued on September 30.
Oct 1
1
A tanker was reported struck while transiting Hormuz, resulting in a fire.
Oct 2
2
One tanker suffered a small fire and blackout; a crude tanker in a
separate incident was struck on the port side near Oman.
Oct 4
1
A tanker reported engine-room damage after being struck by an unknown projectile.
On October 5, UKMTO separately reported an inbound tanker north of
Khasab being instructed by the IRGC to turn back or risk being targeted.
The vessel complied. That report is a security incident, not part of the
seven attack count above.
More traffic can itself increase exposure.
Marisks has assessed that some recent incidents may involve weapons
fired into a predetermined engagement area rather than individually
selected ships. That remains an intelligence assessment rather than
an established explanation for every strike.
Why tankers still go
The market is paying extraordinary money to move each barrel
VLCC Gulf → Asia
$1.2M/day
Recent time-charter-equivalent market level reported by Reuters.
January reference
~$30K/day
Rough benchmark before the wartime freight surge.
Freight share now
~27%
Approximate share of delivered crude cost in Reuters' current analysis.
Pre-war freight share
~3%
Transportation was previously a relatively small component of barrel economics.
Saudi Arab Light Asia
-$5/bbl
November official selling price versus the Oman/Dubai benchmark.
Inventory rebuild demand
+2M bpd
Aramco CEO estimate for approximately 18 months to replenish stocks.
Why flow rises with risk
The system can absorb individual attacks because the network is larger than the casualty
Redundancy
A strike on one tanker does not necessarily stop the pipeline,
shuttle fleet, alternative terminals or other vessels already moving.
Economic pull
High crude prices, inventory depletion and extremely high freight
earnings create strong incentives to keep loading and sailing.
Risk separation
Shuttle systems limit the number of owners and vessels required to
repeatedly enter the highest-risk portion of the trade.
Transfer network
Mother ships can remain outside Hormuz while dedicated shuttle vessels
perform the dangerous portion of the voyage.
Fragility
The system becomes vulnerable when multiple layers fail together:
transfer congestion, pipeline outages, insurer withdrawal or loss of
the protected transit corridor.
Where the system can still break
Different failures remove different parts of the export architecture
Hormuz resilience stress matrix
Directional operational effects rather than probability forecasts
Failure
Immediate effect
Likely workaround
Constraint transferred to
Stress
Another shuttle tanker hit
Localized vessel loss or delay
Replace tonnage / reroute cargo
Fleet availability and insurance
Manageable individually
Fujairah / Sohar STS saturation
Cargo handoff slows
Direct voyages or India / Malaysia STS
VLCC-days and longer cycles
High
East-West pipeline outage
Saudi barrels return toward Gulf
More Hormuz loadings
Shuttle and Strait capacity
Very high
UAE pipeline interruption
Fujairah bypass volumes fall
More Gulf-side loading
Hormuz transit exposure
Very high
Insurance withdrawal
Owners lose financial protection
National / captive fleets
Available willing tonnage
Critical if broad
More direct voyages
Less local STS congestion
Longer tanker employment
Global fleet productivity
Relief with cost
The next limit
High exports do not prove Hormuz has normalized
Oil availability
Recovering
Regional crude exports can now reach or exceed pre-war volumes
on individual days.
Logistics efficiency
Not normal
Record freight, STS congestion, dark transits and attacks remain
embedded in the system.
More barrels can temporarily make the logistics problem worse.
Reuters notes that another increase in Hormuz crude exports could raise
demand for the shuttle architecture before it reduces the region's
transport premium. The system can therefore become busier and more
expensive at the same time that headline supply improves.
Research anchors
Data behind the flow-versus-risk model
Reuters / Kpler / Vortexa — October 5, 2026
18.3M bpd regional seven-day crude export average, 14 September
days above pre-war levels, tanker attacks and current flow recovery.
Kpler Hormuz export reconstruction
60% Hormuz route share, 23% outside-Strait loadings, 17% Red Sea
route share and 40% bypass versus 17% before the war.
Kpler tanker-fleet analysis — September 29, 2026
At least 63 VLCCs identified in the shuttle pool, with approximately
7.6M bpd of implied export-shipping capacity.
UK Maritime Trade Operations
Attack advisories #144–150 and October 5 suspicious-activity report
involving a tanker north of Khasab.
Reuters Open Interest — October 5, 2026
14.2M bpd Strait crude-flow snapshot, $1.2M/day VLCC market,
freight near 27% of delivered crude cost and continuing logistics bottlenecks.
Reuters Saudi pricing — October 5, 2026
November Arab Light pricing to Asia cut to $5/bbl below Oman/Dubai,
with refiners citing compensation for elevated freight costs.
Saudi Aramco CEO — October 5, 2026
Inventory rebuilding may require approximately 2M bpd of additional
demand for 18 months and take as long as two years.
Interactive flow architecture model
Hormuz Flow Resilience & Shuttle Capacity Tool
Change regional exports, the share routed through Hormuz and the share
requiring offshore transfer. The model shows how many full-VLCC cargo
equivalents must cross the Strait, how heavily the shuttle fleet is
being used and how many tanker positions can become tied up in STS operations.
Export architecture
16.5M bpd
60%
70%
Tanker logistics
5.5 days
10 days
$1.20M/day
Modeled shuttle-system loading
The shuttle system is operating close to its modeled capacity
The selected flow mix sends a large share of Hormuz crude into
offshore transfer while retaining a substantial pipeline bypass.
91%
modeled shuttle-fleet utilization
Where the selected crude flow goes
Hormuz
9.90M
Bypass
6.60M
STS flow
6.93M
Flow vs pre-war regional level
-8.3%
Selected regional export flow versus the advanced pre-war reference.
Full VLCC cargo equivalents through Hormuz
5.0/day
Strait crude flow divided by selected full-cargo size.
STS cargo equivalents per day × physical transfer duration.
VLCC positions in full STS system
69
Two vessel positions per transfer across the selected total occupancy period.
Theoretical shuttle fleet capacity
7.64M bpd
Shuttle fleet × cargo size ÷ round-trip cycle.
Fleet market-value equivalent / day
$83.2M
System vessel positions × selected VLCC rate. Not an STS fee or demurrage invoice.
Recent incident cadence
1.0/day
Selected weekly incident count expressed as a daily average, not a probability.
This is a logistics-capacity model, not a vessel casualty probability
model. The default 16.5M bpd scenario uses Kpler's September
non-Iranian export architecture so the 60% Hormuz share and 40% bypass
share are internally consistent. The 70% STS setting reflects the
reported August pattern and is adjustable because transfer behavior is
changing rapidly. Full-VLCC equivalents simplify real cargo parcels.
The market-value result applies a representative tanker market rate to
vessel positions and should not be interpreted as actual demurrage,
charter hire, STS fees or insurance cost.