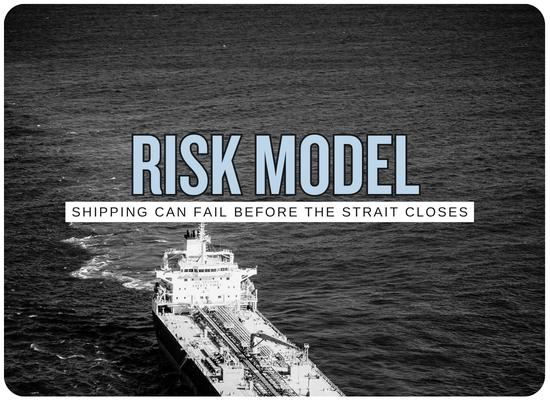
How Much Longer Can Merchant Shipping Operate Through Hormuz Before the Risk Model Breaks?
🔔 Subscribe to ShipUniverse Weekly →

ShipUniverse Hormuz Risk Report

The Point Where Hormuz Freight Can No Longer Buy Another Voyage

The Strait does not need to close for commercial shipping to stop behaving normally. The more important threshold is reached when crew willingness, insurance, freight, ship-to-ship capacity, vessel damage and delay can no longer be absorbed by the economics of the next voyage.
100 confirmed incidents by Oct. 9 24 confirmed fatalities War cover up to $20M VLCCs ~$1.4M–$1.6M/day October 12, 2026
Commercial continuity fuse panel Multiple systems stressed
Crew
Extreme compensation now required for some transits.
Insurance
Cover remains available for some ships at extraordinary cost.
Freight
Record rates still provide the cash to keep ships moving.
STS
Gulf of Oman support infrastructure is near practical limits.
Damage
Fires, blackouts and hull damage convert risk into lost vessel-days.
Contracts
War-risk clauses can shift or stop voyage obligations.
The risk model does not fail at one universal number. Different owners can stop trading at different thresholds. The important question is how much economic and operational headroom remains before another attack, delay or insurance repricing removes that choice.

Merchant shipping has already demonstrated that extraordinary risk does not automatically stop trade. Tankers have continued through Hormuz while ships were being hit, crews were being injured and insurers were charging premiums that would once have been economically unthinkable.

That resilience can be misleading. The system is no longer relying on a normal voyage from loading terminal to buyer. It depends on military awareness, carefully managed transits, dedicated shuttle tankers, enormous war-risk premiums, high crew compensation and offshore cargo transfers outside the Strait.

Each adaptation keeps barrels moving but consumes additional people, capital and vessel-days. That means Hormuz can remain physically navigable while its commercial carrying capacity continues to deteriorate.

The system is already far outside normal

Commercial shipping is operating through conditions that would normally stop a voyage

IMO confirmed incidents
100
Official count through October 9. Additional UKMTO incidents followed.
Confirmed seafarer deaths
24
IMO-confirmed fatalities in the Middle East maritime crisis.
High-end war-risk cover
$20M
Reported cost for some tanker risks in the current market.
Gulf-China supertanker rate
~$1.6M/day
Recent high-end freight indication as tonnage availability tightened.
Master pay example
$100K/mo
With reported transit bonuses reaching another $50,000.
October 6 commodity transits
7
Lowest tracked daily count in more than two months.
A technically open Strait is not the same as normal navigation. The IMO has previously stated that safe passage could not be considered to exist without credible security guarantees. Commercial operators are nevertheless continuing selected voyages because the economic incentive for scarce tonnage remains extraordinary.
The real closure mechanism

Hormuz breaks commercially when one of six gates refuses the next voyage

Gate 1 People

The ship cannot sail without a willing and qualified crew

Higher wages can increase willingness only up to a point. Deaths, injuries, family pressure, fatigue and repeated exposure can remove crew availability even if freight remains profitable.

Gate 2 Insurance

Expensive cover is survivable; unavailable cover is different

War-risk premiums can be absorbed when freight is exceptional. Commercial continuity becomes much harder if underwriters withdraw, exclude particular vessel profiles or demand terms the owner cannot accept.

Gate 3 Freight

Record rates currently subsidize the danger

The same shortage that makes the voyage hazardous also produces enormous earnings. If freight falls before the risk cost falls, the transit can become commercially unattractive very quickly.

Gate 4 STS

A successful Hormuz crossing still needs somewhere to hand off the cargo

Shuttle tankers depend on tugs, hoses, fenders, crews, anchorage space and mother ships around Fujairah and Sohar. Moving the transfer farther away consumes more VLCC-days.

Gate 5 Damage

A non-fatal strike can still remove weeks of useful vessel capacity

Hull damage, a blackout, engine-room damage or fire can create survey, repair, deviation and off-hire exposure without producing a total loss.

Gate 6 Contract

Owners may eventually have the contractual ability to say no

BIMCO war-risk clauses can permit refusal of employment that would expose vessel, cargo or crew to defined war risks, depending on the actual charter wording and circumstances.

The human threshold

Crew compensation now looks less like a wage premium and more like hazard pricing

Current reported compensation

The market is paying directly for willingness to enter the risk zone

Master salary example
$100K/mo
High-end reported compensation for tanker masters.
Transit bonus
$50K
Reported additional bonus for an individual Hormuz passage.
Other crew
4–6×
Reported multiples of ordinary compensation for some sailors.
Crew willingness cannot be modeled like bunker consumption. There is no reliable dollar amount at which a workforce becomes willing indefinitely. A transit can remain profitable on paper while the operator becomes unable to crew it on acceptable terms.
The voyage economics

At today's tanker rates, the Strait can consume more than $20 per barrel before the cargo reaches its buyer

Illustrative 2M-barrel VLCC calculation using published market references. STS services, crew premiums and damage are not included.
17-day Gulf of Oman shuttle-cycle illustration

Vessel time plus high-end war-risk insurance

Vessel time at $1.4M/day
$23.8M
Vessel time at $1.6M/day
$27.2M
High-end war-risk example
$20M
Combined low case
$43.8M
Combined high case
$47.2M
That equals roughly $21.90–$23.60 per barrel. The calculation uses a full 2 million barrel cargo and does not include STS-support charges, crew risk premiums, waiting time, repair exposure or the long-haul voyage after the cargo leaves the shuttle system.
Damage changes everything

At $1.6 million a day, even a survivable casualty carries enormous time value

10 lost days $16M

Vessel-time exposure before repair cost

A ten-day interruption at a $1.6 million daily market rate represents $16 million of gross vessel-time exposure. The figure does not include physical repair, survey, deviation, salvage, cargo delay or deductible costs.

This is why the incident count matters even when most ships survive. Merchant shipping does not need repeated total losses to lose carrying capacity. A succession of damaged but repairable ships can remove enough vessel-days to tighten the fleet and raise the price of every remaining transit.
The logistics threshold

Every mile the transfer moves away from Hormuz requires more ships to move the same oil

Gulf of Oman
17 days
West Coast India
21 days
Malaysia
38.5 days
Shuttle VLCC pool
63+
Identified by Kpler in the current shuttle architecture.
Extra VLCCs for +3M bpd
36–40
Kpler base case as additional transfers spread beyond the Gulf of Oman.
STS capacity converts a security problem into a fleet-productivity problem. A transfer moved from the Gulf of Oman to India is not necessarily lost. It simply occupies the shuttle tanker longer. Move enough cargo farther away and the same export volume begins consuming many more vessels.
The market is already saying no

Tracked traffic is falling without a formal closure

Latest traffic response

The Strait can remain geographically open while vessel participation collapses

October 6
7 vessels
Tracked commodity-vessel crossings, lowest since July 23.
October 6 crude
10.1M bpd
About 74% of Kpler's pre-war Strait reference.
Latest Saturday
5 vessels
Kpler tracked commodity-vessel count.
Latest Sunday
0 tracked
AIS-dark movements mean tracked counts may understate actual crossings.
This is commercial closure by participation rather than geography. The lane can remain navigable on a chart while owners, crews and insurers independently reduce the number of ships willing to use it.
What "break" actually means

The risk model can fail six different ways without the Strait ever being declared closed

Hormuz commercial-continuity matrix Threshold logic rather than a prediction of a formal closure
Constraint Still operating Stress signal Break condition Current direction
Crew Hazard pay attracts personnel Multiples of normal pay required Qualified crews refuse or cannot be sourced Severe
Insurance Cover available at high premium Seven-figure / eight-figure premiums Cover unavailable or commercially unacceptable Severe
Freight Exceptional rate pays extraordinary costs Freight alters crude economics Voyage cost exceeds cargo / charter margin Stretched
STS Shuttles hand cargo outside Strait Fujairah / Sohar near practical limit No transfer slot or enough shuttle tonnage Constrained
Damage Individual ships repaired or replaced Fire, blackout and engine-room damage Lost vessel-days exceed replacement inflow Escalating
Contract Risk allocated between owner and charterer War clauses and disputes invoked Owner legally refuses employment Case specific
The important distinction

The system does not need to collapse everywhere at once

Phase 1 Expensive

Risk can still be priced

Owners find crews, insurers quote cover, cargoes find ships and STS infrastructure retains spare capacity.

Phase 2 Selective

Only certain ships and cargoes still make economic sense

National fleets, older vessels, specialist owners and cargoes with unusually high margins continue while mainstream tonnage withdraws.

Phase 3 Self-rationing

Traffic falls despite no formal closure

Crew, insurance, STS and freight constraints reduce the number of commercially executable voyages below available cargo demand.

Phase 4 Broken

Another dollar of freight cannot buy another reliable transit

The binding constraint becomes physical, human or insurance capacity rather than price. At that point the market cannot clear simply by offering a higher day rate.

Research anchors

Data behind the Hormuz risk model

IMO — Middle East confirmed incidents
100 confirmed maritime incidents and 24 seafarer fatalities as of October 9, 2026.
UKMTO — October 2026 incident feed
Additional tanker strikes, fires and vessel damage through October 11.
Reuters — October 7–12, 2026
Attack cadence, On Peace crew injuries, falling Strait transits, crude-flow reductions and current diplomatic status.
Financial Times
Crew compensation, $50,000 transit bonuses, war-risk cover up to $20 million and extreme VLCC freight rates.
Lloyd's List
MEG-China VLCC earnings around $1.4 million/day and insurance-market warnings that underwriting capacity itself can become a Gulf constraint.
Kpler
63-plus VLCC shuttle architecture, Gulf of Oman STS constraints, 17-day Gulf cycle, 21-day India cycle and 38.5-day Malaysia cycle.
ICS / BIMCO / INTERTANKO / OCIMF guidance
Voyage-specific risk assessment, master's overriding authority and commercial-contract considerations for Hormuz operations.
BIMCO War Risk Clauses
Owners may have rights to reject employment exposing vessel, cargo or crew to defined war risks depending on contractual wording.
Interactive continuity model

Hormuz Risk Model Breakpoint Tool

Estimate how much economic and tanker-capacity headroom remains before an additional delay or casualty pushes a selected Hormuz shuttle voyage beyond its commercial tolerance.

Voyage economics
$1.50M/day
17 days
$20M
$2.0M
$0.75M
$30/bbl
Commercial continuity status
The voyage remains executable, but very little shock absorption remains
Current costs remain below the selected logistics ceiling, but the combination of insurance and fleet utilization leaves limited room for additional lost days.
7.8 days additional lost days before selected cost ceiling
Modeled cost stack per shuttle cycle
Vessel time
$25.5M
War insurance
$20.0M
STS / support
$2.0M
Crew premium
$0.75M
Routine cycle cost
$48.25M
Vessel time, insurance, modeled STS support and crew premium.
Routine logistics burden
$24.13/bbl
Modeled cycle cost divided by selected cargo volume.
Insurance / vessel value
10.0%
Illustrates how extreme insurance can become relative to the asset.
Cost headroom
$11.75M
Dollars remaining before the user-selected per-barrel ceiling.
Shuttle fleet capacity
7.41M bpd
Fleet × cargo size ÷ selected shuttle-cycle duration.
Shuttle fleet utilization
87.7%
Selected shuttle flow divided by theoretical fleet capacity.
10-day casualty case
$66.25M
Routine cost plus selected off-hire time and uninsured damage.
Casualty-case burden
$33.13/bbl
Shows how one survivable incident can cross the selected threshold.
This is a commercial stress model, not a prediction of whether a vessel will be attacked and not a recommendation to transit. The $20 million insurance figure reflects reported high-end market conditions rather than a universal premium. STS-support and aggregate crew-premium inputs are scenario assumptions because consistent public per-voyage totals are not available. Fleet capacity assumes full VLCC-equivalent cargoes and does not capture weather, ballast positioning, maintenance, port delays or multiple STS events. The user-selected cost-per-barrel ceiling represents commercial tolerance and is not an industry standard.
Feedback Welcome

We welcome your feedback, suggestions, corrections, and ideas for enhancements.

Please click here to get in touch

By the ShipUniverse Editorial Team — About Us | Contact