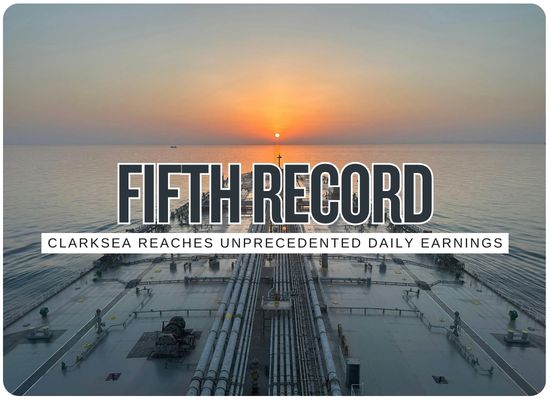
Global shipping earnings have broken another record, with Clarksons Research’s ClarkSea Index rising 12% in the latest week to $84,951 per day, its fifth consecutive all-time high. The benchmark is now about 67.5% above the previous pre-2026 record of $50,714/day set in December 2007. Crude tankers are producing the most extreme figures, with average VLCC earnings reaching $804,601/day, Suezmaxes $724,398/day and Aframaxes $393,951/day. But this is no longer simply a tanker story: US Gulf-Japan VLGC earnings have reached about $209,000/day, the Shanghai Containerized Freight Index is 215% above a year ago, and container charter markets remain tight. Dry bulk weakened in the latest week and LNG carriers remain a notable laggard, meaning the boom is broad rather than literally universal across every vessel class.
ClarkSea Record Run · September 11 to October 9, 2026
Five Weeks. Five All-Time Highs.
The latest record is not an isolated spike. Clarksons' cross-sector
earnings benchmark has broken its historical high every week for five
consecutive weeks, climbing from $56,567 to $84,951 per day.
Latest ClarkSea Index
$84,951
per day
Up 12% in the latest week, approximately 50% above the first
record in this five-week sequence and about 67.5% above the
old December 2007 peak.
2007 Peak$50,714/day
Previous pre-2026 weekly high at the height of the last great shipping supercycle.
2026 YTD Average+70% YoY
The record weekly readings sit on top of an already exceptional full-year market.
Versus 10-Year Trend+87%
Clarksons' year-to-date average remains almost twice the recent long-run trend.
Q3 Average$46,384/day
Q3 itself set a quarterly ClarkSea record before October's latest acceleration.
The Five-Record Staircase
Weekly ClarkSea readings. Bar heights are scaled only to show the progression
within the five-record sequence.
Sep. 11$56,567+24% WoW
Record 1
Sep. 18$64,569+14% WoW
Record 2
Sep. 25$66,421+3% WoW
Record 3
Oct. 2$75,658+14% WoW
Record 4
Oct. 9$84,951+12% WoW
Record 5
Where the Market Stands Now
VLCC$804,601/day
Up 21% week on week. Crude tankers remain the strongest force behind the index.
Suezmax$724,398/day
Up another 17% in the latest Clarksons assessment.
Aframax$393,951/day
Latest weekly increase of 46%, highlighting tightening below the VLCC segment.
VLGC · USG-Japan~$209K/day
Record LPG-carrier earnings show that exceptional conditions extend beyond crude oil.
Containers · SCFI3,664
Shanghai Containerized Freight Index stands about 215% above a year ago.
Capesize$31,130/day
Still healthy, but down 16% in the latest week.
Overall Dry Bulk$22,319/day
Down 3% week on week, showing that not every segment is accelerating simultaneously.
Modern LNG Carrier$34,250/day
Down 19% and the clearest major-sector laggard in the current shipping boom.
Broad does not mean universal.
Tankers and VLGCs are at extraordinary levels, containers remain exceptionally
firm and other sectors are supporting the ClarkSea benchmark. But dry bulk softened
in the latest week and LNG carrier spot earnings remain comparatively weak.
Why Record Cargo Flows Can Produce Even Higher Freight
The Market Is Short of Productive Ship-Days, Not Necessarily Ships
More cargo is moving, but conflict, ship-to-ship transfers, longer routing,
sanctions and waiting time mean each vessel completes fewer efficient voyages.
That turns logistical friction into demand for additional tonnage.
The 2026 Freight Multiplier
Step 1Cargo Returns
Middle East crude exports have repeatedly returned to or exceeded
prewar levels, putting more physical barrels into the shipping system.
→
Step 2Normal Routing Does Not
Hormuz risk, Red Sea disruption, offshore transfers and alternative
loading points keep the transport network fragmented.
→
Step 3Ship-Days Multiply
Waiting, shuttling, positioning and longer voyages consume more days
per transported barrel or tonne.
→
Step 4Prompt Tonnage Tightens
Charterers compete for the smaller pool of vessels available in the
correct location at the required time, pushing earnings upward.
Sanctioned Tanker Capacity
121M DWT
Clarksons counts 1,010 individually sanctioned oil tankers.
The vessels still physically exist, but sanctions fragment the market
and can remove significant capacity from mainstream charterers.
Oil Tanker Fleet17%
Share of total oil-tanker capacity represented by individually sanctioned vessels.
Crude Tanker Fleet20%
Share of crude-tanker capacity on individual sanctions lists.
VLCC Capacity18%
Sanctioned share identified by Clarksons in its October 9 update.
Crude Aframax35%
Particularly large sanctioned share in a segment already exposed to regional trade fragmentation.
Freight Is Now Altering the Commodity Trade Itself
US Gulf-China VLCC~$80M
Recent cost to move a roughly 2-million-barrel cargo to China.
Freight per Barrel~$40
Reuters reported this versus about $8.60/bbl before the February war.
Since Mid-August+300%+
Increase in US Gulf-Asia and Fujairah-East VLCC freight cited by Sparta Commodities.
ResultArbitrage Shuts
Some Asian refiners are switching crude origins because transport cost overwhelms normal price differentials.
A durable reopening of Hormuz and the Red Sea, lower STS dependence,
shorter voyage patterns, weaker commodity demand or enough newbuilding
deliveries to restore effective vessel availability.
Ship Universe Record Earnings Tool
Record Rate & Normalization Analyzer
Convert today's extreme shipping rates into annualized gross earnings,
then test what happens if the market normalizes by 25%, 50% or 75%.
Users can also enter their own long-run reference rate.
ships
days
%
$/day
$/day
Current Market Rate$804.6K
current Clarksons market assessment used by the selected preset
Annualized Current Revenue$281.6M
current rate × revenue days × entered fleet size
Rate After Correction$804.6K
current market less entered percentage correction
Annualized Stress Revenue$281.6M
stress-adjusted rate × entered revenue days
Revenue Lost$0
annualized difference from today's selected market rate
Current Rate vs User Normal10.1×
selected current market divided by entered reference rate
How Far Above Normal?
The reference rate is deliberately user controlled. It is not presented
as a Clarksons forecast or historical sector average.
Current Market
$804.6K
Stress Case
$804.6K
User Normal
$80K
Selected Scenario
Record Market
No rate correction has been applied. The model therefore annualizes
today's selected market assessment across the entered revenue days.
MarketVLCC
Ships1
Rate Cut0%
Daily OPEX$12K
Scenario tool only:
daily market earnings are not the same as realized accounting profit.
Actual cash generation depends on bunker costs, port costs, commissions,
ballast positioning, waiting time, off-hire, insurance, war-risk premiums,
charter structure, financing, drydock costs and vessel-specific operating expenses.
The user-entered "normal" rate is a scenario assumption rather than a market forecast.
Feedback Welcome
We welcome your feedback, suggestions, corrections, and ideas for enhancements.