Container Port Congestion Eases on Paper, but Cargo Delays Still Hit Key Trade Lanes
🔔 Subscribe to ShipUniverse Weekly →
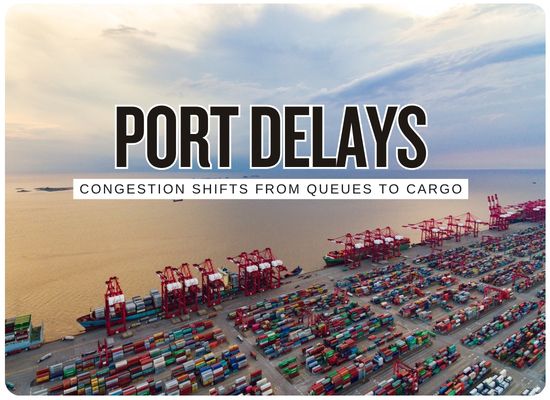
Container port congestion is no longer moving as one global emergency, but the pressure remains visible in the places that matter most for shippers, forwarders and carriers. Shanghai and Ningbo are still recovering from weather-driven backlogs and vessel bunching, Singapore remains tight because of strong demand and transshipment pressure, and Busan is dealing with heavy berth congestion and high transshipment inventory. In Europe, Rotterdam and Antwerp have improved from earlier stress but still face vessel queues, pilot delays, Rhine River disruption and yard-pressure issues. North America is mostly avoiding the extreme ship queues seen during the pandemic, yet import dwell, chassis pressure, rail handoff and local drayage timing remain active problems at Los Angeles/Long Beach, Savannah, New York and Vancouver.
Congestion Is Becoming More Local and More Operational
The biggest risks are no longer just ships waiting offshore. They are missed windows, rollovers, yard density, rail dwell and inland recovery.
China Recovery Delays
Shanghai and Ningbo remain the key watch points after weather disruptions, with service-specific waits and rollovers still affecting schedules.
Singapore Transshipment Pressure
Singapore is not in crisis mode, but strong demand and vessel bunching are creating uneven wait times and tighter connection planning.
North Europe Still Fragile
Rotterdam and Antwerp have eased from worse levels, but queues, berth constraints, pilot delays and inland water disruption are still active.
U.S. Ship Queues Contained
Major U.S. gateways are not showing pandemic-style vessel queues, but import dwell, rail handoff and chassis friction remain cargo-level issues.
Africa and Secondary Ports
Some of the worst waiting times are now outside the usual headline ports, including Conakry, Beira, Tema, Abidjan and Durban.
The operating read is that congestion has shifted from a universal queue story into a reliability story. The cargo most exposed is cargo that depends on tight transshipment, narrow delivery windows, inland rail, reefer plugs, equipment availability or low-cost storage assumptions.
Global Container Congestion Board
Current pressure is uneven: some benchmark ports are improving, while service-specific delays and secondary-port bottlenecks remain severe.
The cleanest way to read the market is by separating headline vessel waiting from cargo availability. A port can show a short average berth wait while still producing long dwell, rollover, rail, gate or transshipment delays. That is the pattern now visible across several regions.
Drewry WCI per 40ft container, up 4% in the latest weekly reading.
Drewry-reported average waiting time at Shanghai during week 33.
Carrier-reported Shanghai Yangshan waiting range for selected services.
Kuehne+Nagel-reported 7-day average vessel wait at Conakry.
Congestion Signal Table
| Port / Region | Latest Signal | Commercial Read | Stakeholders | Status |
|---|---|---|---|---|
| Shanghai / Ningbo | Weather backlogs, yard pressure and vessel bunching continue after East China disruptions. | The biggest risk is not only waiting time, but rollovers, missed windows, revised transshipment and schedule recovery. | Asia exporters, carriers, forwarders, BCOs, rail and truck providers | High |
| Singapore | Average waiting is tight, with non-Gemini services facing materially longer delays than Gemini services. | Service type and alliance routing now matter more than the port-wide average. | Transshipment cargo, feeder operators, carriers, inventory planners | Medium |
| Busan | Berth congestion and heavy transshipment inventory continue, with laden yard utilization above 100% at BNCT. | Busan remains a key North Asia connection-risk port, especially for transshipment cargo. | Transpacific carriers, feeder lines, Korean exporters, relay cargo owners | Watch |
| Rotterdam / Antwerp | Average wait times have eased, but queues, Rhine disruption, pilot delays and yard issues remain active. | North Europe is better than earlier in the summer, but inland legs remain a weak point. | European importers, barge operators, rail planners, forwarders | Watch |
| Genoa / La Spezia | Staffing shortages, berth constraints, trucking disruption and rail limits are affecting Italian gateways. | Southern Europe risk is more about labor and landside execution than large offshore queues. | Med importers, rail operators, trucking firms, terminal planners | Medium |
| Los Angeles / Long Beach | Vessel queues are contained, but local import dwell, on-dock rail dwell and chassis pressure remain active. | Southern California’s risk is not vessel anchorage, it is how quickly cargo leaves the terminal network. | Retailers, drayage firms, chassis pools, railroads, warehouses | Lower |
| Savannah / New York | Vessel bunching, terminal utilization and extended dwell are still creating delays. | East Coast cargo remains exposed to inland timing even when berth waits look manageable. | Importers, railroads, truckers, warehouse operators, brokers | Medium |
| Vancouver | Vessel waits are moderate, but rail dwell remains a concern. | Canadian congestion is more about rail network recovery and inland evacuation than ship waiting alone. | Railroads, importers, exporters, terminal operators, drayage providers | Watch |
| West Africa | Conakry, Tema and Abidjan show some of the highest waiting times in the current update set. | Secondary-port congestion can create the largest schedule losses even when global headlines focus on mega hubs. | Africa importers, project cargo firms, feeder lines, regional forwarders | High |
| Durban / Beira | South and Southeast African operations remain exposed to congestion, system issues, weather and berth pressure. | Delays can cascade into reefer rollovers, dry cargo misses and inland delivery uncertainty. | Reefer exporters, carriers, terminals, inland hauliers, cargo owners | High |
| Jeddah / Gulf routes | Yard density and rerouted cargo continue to affect Middle East planning. | Land-bridge and diversion cargo can relieve one chokepoint while creating another at the port gate. | Gulf importers, truckers, container lines, customs brokers, warehouses | Watch |
Container Congestion Cost Estimator
Estimate delay exposure from vessel waiting, terminal dwell, rail dwell, rollovers, demurrage and inventory carrying cost.
Total estimated exposure before recoveries.
Estimated remaining exposure after recoverable cost assumptions.
Combined vessel, terminal, rail and rollover delay days.
Estimated net congestion cost per affected container.
The modeled shipment group has enough dwell, rail and rollover exposure to justify active recovery planning.
Review routing and free timeThis tool is for editorial and commercial sensitivity only. It does not replace carrier invoices, terminal tariffs, demurrage contracts, freight-forwarder quotes, live vessel schedules, customs data, warehouse availability, drayage pricing or professional logistics advice.
We welcome your feedback, suggestions, corrections, and ideas for enhancements.
Please click here to get in touch