U.S. Container Imports Race Toward a New Peak Season Record
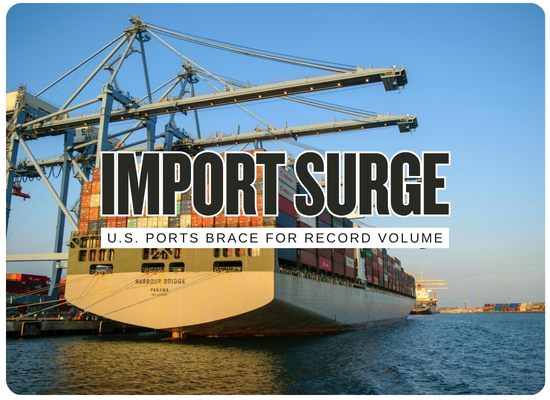
U.S. container imports are moving into record territory as retailers, manufacturers, and importers pull cargo forward before potential August tariffs, higher transportation costs, and additional trade-policy changes hit landed costs. The latest port-tracker forecast puts July at 2.47 million TEU across major U.S. container gateways, enough to surpass the previous monthly import record set during the post-pandemic cargo surge. June was already extremely strong, with more than 2.4 million TEU handled and a sharp year-over-year jump in China-origin volumes. The surge is creating an early peak season that looks very different from the traditional fall build, with importers prioritizing tariff timing, inventory protection, back-to-school demand, holiday readiness, fuel-linked freight adjustments, and customer price sensitivity.
Ship Universe Import Watch
Operator Impact Snapshot
The U.S. import rush is compressing peak season, tariff timing, inventory planning, and inland capacity into one early-summer surge.
The newest import forecast points to a record July, but the operational story is more layered than a single monthly high. Cargo is being pulled forward because importers are trying to beat tariff exposure, freight-cost resets, fuel-linked charges, and trade uncertainty before late summer.
Frontloaded import pressure
Retailers and manufacturers are accelerating shipments, moving peak-season volume earlier and creating a stronger near-term pull through major U.S. gateways.
Tariff timing exposure
Importers are trying to land goods before potential August tariff changes, making customs timing and cargo release windows more commercially sensitive.
Post-surge volume drop
Forecasts point to weaker year-over-year volumes after July, which could leave carriers and inland providers managing a sharp shift from surge to slowdown.
Port fluidity test
Ports are handling elevated cargo without broad vessel queues so far, but the pressure can move quickly into rail ramps, drayage, warehouses, and chassis pools.
Landed-cost reset
Freight rates, fuel-linked adjustments, tariffs, detention, demurrage, and inventory carrying costs are all being recalculated at the same time.
Commercial Reading
This is an early peak-season import wave driven by cost avoidance and uncertainty. The next operating challenge is matching the cargo rush with enough inland capacity, customs discipline, warehouse space, and inventory planning before volumes cool.
- Carriers: protect service reliability while watching whether July demand fades into softer late-summer bookings.
- Ports: keep yard turns, rail dwell, gate hours, reefer capacity, and empty container flow visible.
- Importers: review customs timing, tariff classification, storage space, purchase order timing, and price-pass-through plans.
- Forwarders: prepare for compressed documentation, more arrival changes, and customers asking for landed-cost comparisons.
- Warehouses and drayage firms: plan for short-term congestion pockets even if anchorages remain clear.
U.S. Container Import Board
Record Forecast, Cost Pressure, and Inland Flow Signals
The July import forecast points to a new monthly high, followed by a likely cooling period after the frontloaded rush.
Latest Volume Setup
Projected volume across major U.S. container ports, enough to set a new monthly record.
Descartes reported 2,400,627 TEU handled by U.S. seaports in June.
June imports rose as buyers accelerated cargo ahead of higher tariffs and transportation costs.
China-origin imports rose sharply year over year and drove much of the monthly gain.
Import Surge Table
| Issue Area | Latest Detail | Market Effect | Stakeholder Move | Pressure Meter |
|---|---|---|---|---|
| July Record Setup Forecast import peak | Major U.S. ports are forecast to handle 2.47 million TEU in July, which would exceed the prior monthly record. | Near-term cargo pressure supports vessel utilization, port activity, drayage demand, and warehouse intake. | Protect appointment slots, chassis access, customs release timing, rail plans, and receiving capacity. |
High
|
| Tariff Frontloading August risk window | Importers are accelerating cargo before possible new tariffs and trade-policy changes take effect. | Pulls demand into July, but can weaken bookings later if inventories were built too early. | Model landed costs by arrival date, customs entry timing, tariff code, and inventory carry cost. |
High
|
| Freight Cost Reset Fuel and contract adjustments | Carriers and shippers are factoring in higher transportation costs, including fuel-linked changes and contract resets. | Rate increases can hit landed costs even when tariff exposure is avoided. | Compare all-in delivered cost by sailing, not only ocean base rate. |
Medium High
|
| China-Origin Rebound Large monthly contributor | China-origin volumes rose 27.4 percent year over year in June, reaching more than 814,000 TEU. | Shows importers still rely heavily on China supply chains when tariff timing creates urgency. | Recheck supplier lead times, forced-labor documentation, tariff exposure, and alternate sourcing plans. |
High
|
| Port Fluidity Terminals and anchorages | Major gateways are handling high volume without widespread vessel queues, but pressure can shift inland. | Congestion risk may appear first in yard dwell, rail dwell, warehouse capacity, or empty container flows. | Watch local gate conditions, rail cutoffs, empty return rules, and appointment availability. |
Watch
|
| Late-Summer Pullback Forecast cooling | Forecasts show August, September, October, and November volumes falling below year-earlier levels after the July peak. | Carriers may face booking softness after the frontloaded wave, while warehouses may hold more inventory for longer. | Avoid assuming July strength will carry through the rest of peak season. |
Watch
|
Import Frontload Cost Calculator
Compare tariff exposure, freight increases, inventory carry cost, and timing pressure for early U.S. imports.
This tool helps importers, forwarders, brokers, and logistics teams estimate whether pulling cargo forward creates enough savings to offset higher freight and inventory carrying costs.
Potential Tariff Avoidance
$1,625,000
Estimated avoided tariff cost if goods arrive before the selected tariff exposure applies.
Added Freight Cost
$212,500
Estimated incremental transportation cost tied to higher rates or fuel adjustments.
Inventory Carry Cost
$224,384
Estimated extra carrying cost from receiving cargo earlier than normal demand timing.
Net Frontload Benefit
$1,158,116
Estimated benefit after freight, inventory, and delay-risk costs.
Import Timing Signal
The frontload case looks strong under these assumptions. The key risk is whether receiving capacity, customs timing, and inventory plans can absorb the early volume cleanly.
We welcome your feedback, suggestions, corrections, and ideas for enhancements.
Please click here to get in touch