Red Sea Rerouting Costs Owners Still Miss
May 12, 2026
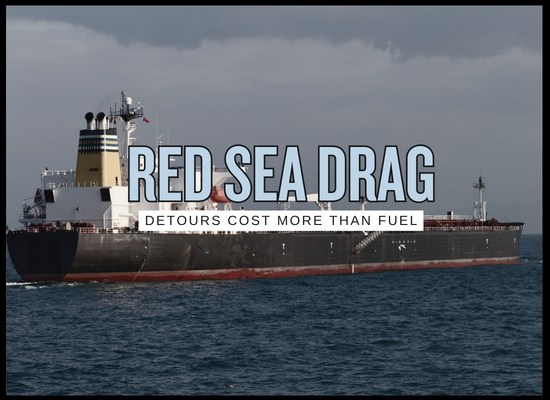
Red Sea rerouting is now much more than a longer line on a voyage map. Owners are paying for added sea time, higher bunker consumption, war-risk treatment that can still remain voyage-specific, cargo and schedule instability, port knock-on effects around Africa, and crew exposure that does not disappear just because a ship avoids the most dangerous segment. UNCTAD says rerouting around the Cape of Good Hope has lengthened voyage distances and times while increasing fuel use and costs, and MARAD’s active 2026 advisory still warns that commercial vessels in the Red Sea, Bab el Mandeb, Gulf of Aden, Arabian Sea, and Somali Basin face direct and collateral risks, including attempted diversion from course by entities claiming Yemeni authority.
Interactive route tool
Red Sea Rerouting Hidden Cost Checker
This tool helps owners test whether Cape routing still looks acceptable once extra days, bunker drag, schedule weakness, crew burden, and capacity loss are combined.
Inputs
Build the route-change profile and the hidden commercial stack around it
Voyage profile
Direct hidden cost layers
Commercial drag and control
Outputs
See whether the detour is still manageable or whether the hidden stack is now doing most of the damage
Hidden-cost pressure
0 / 100
Higher means the detour is behaving like a broader operating-model cost, not just extra mileage.
Direct rerouting stack
$0
Extra bunker, security, crew, port-shift, and delay cost combined.
Unrecovered owner exposure
$0
Directional value left on the owner side after recovery strength is applied.
Commercial reading
Review
Plain-language view of whether the rerouting case still looks commercially comfortable.
Network drag
0 / 100
How strongly the reroute appears to weaken schedule integrity and effective fleet productivity.
Stress-adjusted voyage value
$0
Directional voyage value remaining after hidden detour drag is reflected.
The tool is evaluating whether the rerouting decision is still commercially acceptable once the hidden cost stack is added back in.
Where the cost is hiding
What still supports the route
What owners should watch next
Model note
This is a directional owner tool. It does not replace voyage estimation, broker advice, or network planning. It helps show whether Red Sea avoidance is now creating more cost than a simple detour model would suggest.
This is a directional owner tool. It does not replace voyage estimation, broker advice, or network planning. It helps show whether Red Sea avoidance is now creating more cost than a simple detour model would suggest.
We welcome your feedback, suggestions, corrections, and ideas for enhancements. Please click here to get in touch.