
🔔 Subscribe to ShipUniverse Weekly →
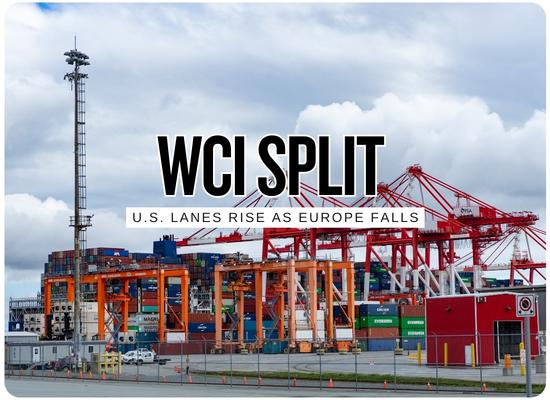
Drewry’s latest World Container Index update showed the composite rate holding steady at $4,465 per 40ft container on September 3, with higher Transpacific prices offset by lower Asia-Europe rates. Shanghai to Los Angeles increased 5% to $7,185, while Shanghai to New York rose 3% to $9,587. Asia-Europe moved the other direction, with Shanghai to Genoa down 10% to $4,368 and Shanghai to Rotterdam down 5% to $4,092. The operating backdrop remains active: Drewry pointed to more Transpacific blank sailings next week, softer Asia-Europe demand, returning Suez Canal capacity, Middle East disruption around Hormuz, Chinese port congestion after Typhoon Saudel, and Panama Canal restrictions scheduled to tighten later in September.
Ship Universe Container Rate Watch
Operator Impact Snapshot
The headline index held flat, but the lane split widened between U.S.-bound cargo and Asia-Europe cargo.
Composite holds at $4,465
The WCI stayed flat as stronger Transpacific rates offset weaker Asia-Europe pricing.
Los Angeles lane rises 5%
Shanghai to Los Angeles increased to $7,185 per 40ft container, keeping U.S. West Coast spot exposure high.
New York lane reaches $9,587
Shanghai to New York rose 3%, remaining the highest major Drewry lane in this update.
Genoa drops 10%
Shanghai to Genoa fell sharply to $4,368 as Asia-Europe demand softened and capacity shifts changed the lane balance.
Rotterdam slips 5%
Shanghai to Rotterdam declined to $4,092, putting North Europe in a weaker pricing lane than the Transpacific.
47 blanks ahead
Drewry’s latest tracker shows 47 cancelled sailings across major East-West trades from weeks 37 to 41.
WCI Rate Board
Flat Composite, Wider Lane Split
The U.S. lanes moved higher while Asia-Europe gave back rate strength.
Stable per 40ft container in the September 3 assessment.
Up 3%, the highest named route in this weekly update.
Up 5%, supported by resilient demand and tighter capacity management.
Expected cancelled sailings from weeks 37 to 41, a 6% cancellation rate.
| Lane or Driver | Latest Figure | Market Reading | Planning Effect | Pressure Meter |
|---|---|---|---|---|
| Composite WCIGlobal benchmark | $4,465 per 40ft, stable for the week. | The headline index hides opposite moves between Transpacific and Asia-Europe routes. | Index-linked contracts and spot buying need lane-specific review, not just composite tracking. | Medium High |
| Shanghai to Los AngelesAsia to U.S. West Coast | $7,185 per 40ft, up 5%. | West Coast pricing strengthened despite the composite holding flat. | Late spot buyers still face a high absolute rate and risk of tighter allocation. | High |
| Shanghai to New YorkAsia to U.S. East Coast | $9,587 per 40ft, up 3%. | East Coast pricing remains the premium route in this WCI set. | Cargo routed through U.S. East Coast gateways carries the strongest rate exposure. | Severe |
| Shanghai to GenoaAsia to Mediterranean | $4,368 per 40ft, down 10%. | The Mediterranean lane posted the steepest percentage decline among the major routes named. | Buyers with flexibility may see negotiating room, especially if demand remains softer. | Medium |
| Shanghai to RotterdamAsia to North Europe | $4,092 per 40ft, down 5%. | North Europe softened while U.S.-bound lanes moved higher. | Lower ocean rates can still be offset by schedule reliability and inland disruption costs. | Medium |
| Transpacific Blank SailingsCapacity management | Six blank sailings announced for next week, twice this week’s level. | Carriers are tightening capacity while demand remains resilient. | The next U.S.-bound rate move may depend more on available sailings than on the composite index. | High |
| Asia-Europe Blank SailingsMore capacity returning | Blank sailings are set to drop from four this week to one next week. | Additional capacity is entering a lane where demand is already softening. | Spot rates may decline modestly if cargo does not absorb the extra capacity. | Watch |
| Suez Canal ReturnsCapacity and transit-time reset | Ocean carriers are ramping up Suez Canal transits as services return. | Returning Suez capacity can reduce Cape of Good Hope cost penalties and long lead times. | Network schedules may improve, but service changes can still create short-term reshuffling. | Medium High |
| Chinese Port CongestionTyphoon disruption | Chinese ports remain constrained after Typhoon Saudel and recent typhoon disruption. | Congestion can support rates even when some lanes look softer on demand. | Shippers need more lead time for factory cutoffs, cargo ready dates and feeder connections. | High |
| Panama Canal LimitsSeptember transit caps | Capacity is limited to 34 daily transits early September and 32 later in the month, with Neo-Panamax slots capped at nine per day. | Canal constraints can keep U.S. East Coast routing sensitive even when vessel supply improves elsewhere. | All-in landed cost should include canal timing, surcharge risk and schedule recovery buffers. | High |
| Forward Cancellation MixWeeks 37 to 41 | 47 blanks out of 729 planned sailings, with 68% of cancellations on Transpacific eastbound services. | The cancellation burden is concentrated where U.S.-bound rates are still rising. | BCOs and forwarders should watch Transpacific allocation before assuming rates are capped. | High |
WCI Lane Cost and Booking Pressure Tool
Use the September 3 WCI rates to model freight cost, surcharges, possible rate moves and delay exposure.
Base Ocean Freight
$479,350
Selected WCI lane rate multiplied by 40ft container count.
Total With Surcharges
$511,850
Base ocean freight plus selected surcharge assumptions.
Next-Week Rate-Move Impact
$10,237
Estimated change if the selected lane moves by the chosen percentage.
Delay Exposure
$13,750
Modeled cost of rollover, port congestion, canal delay or schedule disruption.
Booking Signal
The model shows high booking pressure from elevated lane rates, capacity management and routing disruption.