
🔔 Subscribe to ShipUniverse Weekly →
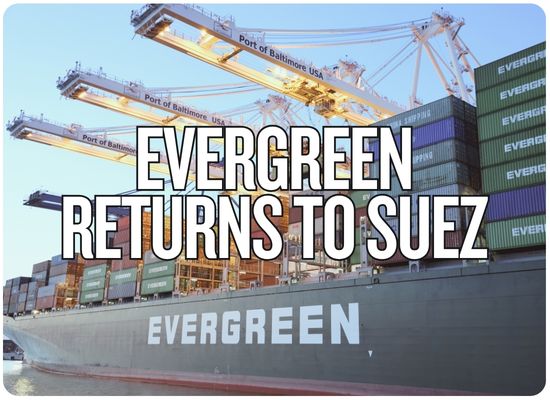
Evergreen is preparing to resume Suez Canal transits with three large containerships totaling 53,236 TEU of nominal capacity, marking the Taiwanese carrier's first scheduled return to the Red Sea corridor in nearly three years. Linerlytica identifies the 16,556-TEU Ever Eon and Ever Edit for November 7 and 11, followed by the 20,124-TEU Ever Gifted on its Asia–Mediterranean service. Evergreen was the last Ocean Alliance member holding back its own vessels from the corridor, and its return brings the industry closer to restoring traditional Asia–Europe routes. Analysts now anticipate a much broader Suez recovery by the first quarter of 2027, leaving Israeli carrier ZIM increasingly isolated among major lines still routing around Africa. The consequences could extend far beyond shorter voyages: Xeneta estimates that a comprehensive Suez return could release the equivalent of 6%–8% of global containership capacity previously absorbed by longer sailing distances.
Evergreen's Suez Comeback Starts With Three Megaships
Two Northern Europe-bound service rotations and a major Mediterranean vessel are scheduled to re-enter the Red Sea corridor.
The Three Scheduled Canal Transits
Dates reflect public service plans as of November 5. None of these future passages has been verified as completed.
The Canal Recovery Is Already Underway
Indicative comparison of late-October 2026 throughput capacity with the October 2023 reference.
The Suez Switch Is Releasing Vessel Positions
Carriers can preserve weekly departures with smaller route fleets. The resulting capacity may be redeployed, withdrawn, returned to charter owners or retained for reliability.
Premier Alliance MD1: A Documented Service Example
Planned deployment change following a return to Suez. This example concerns MD1, not Evergreen's NEU7/CES or MD2 services.
Who Is Returning, and Who Still Faces Restrictions?
Alliance-wide plans should not be confused with confirmation that every vessel, direction and named service has already switched.
| Carrier / Alliance | Verified Development | Current Scope and Qualification | Potential Operating / Market Effect | Next Evidence to Check |
|---|---|---|---|---|
| Ocean Alliance CMA CGM, COSCO, OOCL, Evergreen |
Evergreen joins the return | Ever Eon and Ever Edit planned on NEU7/CES; Ever Gifted on MD2. Partners have already restored selected services. | Improved common routing within alliance services could reduce fleet time tied up on longer voyages. | Actual Evergreen transit logs, westbound routing, final service rotations and effective vessel counts. |
| Gemini Cooperation Maersk, Hapag-Lloyd |
ME1 return announced Nov 2 | India–Europe ME1 routed through Suez with November transition departures; other services have already resumed. | Shorter service cycles can improve transit time and free ships depending on deployment decisions. | Completed ME1 passages, port-to-port transit times and additional fleet releases. |
| Premier Alliance ONE, Yang Ming, HMM |
MD1 and MS2 changes | Further November/December transitions planned; MD1 adds Sokhna and is scheduled to use 12 ships instead of 16. | Lower ship count for the same sailing frequency could reduce charter demand or provide capacity elsewhere. | MD1 actual canal passage, final schedule dates, additional route conversions and retained exceptions. |
| MSC Independent network |
Majority of services returning | MSC has restored substantial Asia–Europe coverage, although some individual directions and services may remain via Cape. | Large network scale makes MSC redeployment choices important for charter and spot-rate markets. | Full-loop conversions, redeliveries, capacity offered and freight-rate developments. |
| ZIM Independent Israeli carrier |
Prominent major holdout | ZIM's relevant Asia–Europe services remain Cape-routed in available reporting; Israeli-linked security exposure is a major differentiator. | Longer voyage and fleet requirements may persist while competitors shorten routes. | Official ZIM advisories, risk assessments and any independently confirmed change in routing. |
| Other remaining exceptions | Not every service has returned | Reports still identify certain Cape-routed services, including HMM's FIM pendulum and Tailwind's Panda Express. | Different routing strategies may preserve longer transit times and different capacity needs on particular strings. | Individual service schedules, not carrier-level predictions alone. |
Earlier estimate of effective global containership capacity released by a comprehensive Suez return, not measured capacity already released.
Potential nominal capacity released by restoring both directions on further Asia–Mediterranean services.
Additional potential capacity if Ocean Alliance and MSC convert further services over the subsequent three months.
What Happens When a 16-Ship Service Needs Only 12?
Model fleet positions potentially released by shorter Suez rotations, estimate fuel and canal-cost differences, and separately test the effect of changing freight rates.
Vessel Deployment & Cost Inputs
The reference cycle times are derived from the published MD1 example. All ship capacities and dollar costs below are hypothetical.
Difference between whole vessels needed to maintain the selected weekly service frequency. No actual redelivery or commercial redeployment is implied.
Vessels Required to Maintain the Same Service
Both bars reflect the number of vessels needed for the selected round-trip cycle. Extra theoretical capacity only becomes commercially available if operators actually change deployment.
Separate Freight-Rate Exposure
This is a user-defined scenario, not a model-derived forecast based on ship releases.
At the selected cargo exposure, a 5% drop in the assumed spot rate would lower the weekly freight value by $175,000. A future rate decline is not guaranteed.
Required service vessels = ceiling(round-trip cycle days × weekly departures per direction ÷ 7). The reference uses 112 days by Cape and 84 days by Suez, corresponding to 16 versus 12 vessels for a weekly service. The 112-day Cape cycle is inferred from Linerlytica's 16-vessel weekly rotation; 84 days is the reported planned Suez cycle. Other presets are hypothetical and are not descriptions of additional actual alliance conversions.
Potential released positions = maximum of zero and the difference between the two vessel requirements. Nominal released capacity = released positions × selected TEU per vessel. This is fleet inventory capacity, not new weekly available freight capacity, an increase in global ship supply or the actual number of ships returned to their charter owners.
Annualized gross charter-cost exposure = released positions × daily charter cost × 365. This only becomes an avoidable cash cost if the corresponding vessels can actually be redelivered or otherwise removed from paid charter commitments. It is not revenue, profit or a confirmed saving. Voyage fuel avoidance is modeled independently as sailing days avoided × fuel consumed per day × bunker price. Added costs = two Suez tolls plus two added security/insurance charges per round trip. Voyage variable-cost difference = fuel avoided less those costs. Annualized voyage-cost difference multiplies by 365 × weekly departure frequency ÷ 7, assuming steady continuous service.
The model deliberately does not add charter exposure to variable-cost differences. Contracts, hired vessels, bunker responsibilities and actual voyage costs may overlap or differ from the simplified scenario. It excludes port charges, canal waiting time, emissions costs, changes in speed and fuel burn, security incidents, cargo handling, charter termination costs, fleet redeployment earnings and schedule disruption. The freight sensitivity is independent: assumed rate × spot-exposed FEUs × selected rate percentage change. It is not a rate forecast.
We welcome your feedback, suggestions, corrections, and ideas for enhancements.
Please click here to get in touch