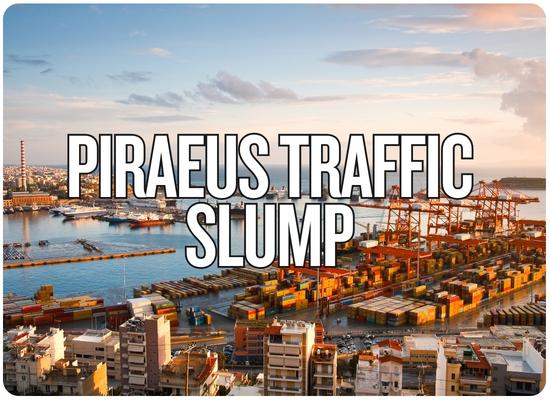
Piraeus Port Authority reported a 27.8% decline in container throughput at its directly operated Pier I terminal for January–September 2026, handling 394,338 TEU compared with 546,399 TEU a year earlier. Cruise passenger traffic fell 19.0% to 1,264,350, while cruise-ship calls declined from 698 to 584. In financial results released November 3, the Greek port operator reported an 8.2% revenue decline to €178.8 million and a 21.5% reduction in net profit to €59.7 million. Pier I returned to marginal growth of 0.3% in the third quarter, and management expects Suez-linked container traffic to recover fully by May 2027. That date is a company forecast, not a confirmed shipping-line schedule.
ShipUniverse | European Port Financial Intelligence
Piraeus has been hit on both its container and cruise businesses. The full nine-month results show the scale of the decline, while third-quarter data point to the first signs of recovery.
Pier I container throughput−27.8%394,338 TEU, first nine months of 2026
Cruise passengers−19.0%1,264,350 passengers
Group net profit−21.5%€59.7 million after tax
Group revenue−8.2%€178.8 million
Two Traffic Declines, Side by Side
January–September comparisons. The 2025 bar equals 100% for each individual measure, allowing a direct visual comparison of year-on-year changes.
Container terminal | Pier I only
Total container movements
−152,061 TEU
2025
546,399
2026
394,338
The percentage applies specifically to PPA-operated Pier I, not a reported combined throughput decline for all Piraeus container terminals.
Cruise | Total passengers
Passengers handled
−297,504
2025
1,561,854
2026
1,264,350
Cruise calls also fell 16.3%, from 698 to 584. Homeport passengers declined faster than total passengers, down 22.1%.
The Financial Damage
Revenue lost year on year€15.90MReported group revenue comparison
Net profit lost year on year€16.39M€76.05M in 2025 vs €59.66M in 2026
Pier I pre-tax swing−€10.4MFrom €6.5M profit to €3.9M loss, rounded segment figures
Early Improvement, but Not a Full Recovery
Q3 Pier I movement+0.3% YoY
Throughput increased 524 TEU in the July–September quarter, after declines earlier in 2026.
Suez-route forecastMay 2027
PPA management's estimate for full restoration of Suez-linked container traffic, dependent on shipping conditions.
The 2026 Piraeus Scorecard: Where Traffic and Earnings Diverged
Twenty operating and financial comparisons from the November 3 disclosure. Negative outcomes in containers and cruise contrast with improving concession revenue, dry-dock activity and ferry income.
Measure
2026
Comparison period
Change
Interpretation / exposure
Container terminal | Pier I only | January–September
Total container throughput
394,338 TEU
546,399 TEU
−27.8%
152,061 fewer TEU at the directly operated terminal, not the entire port.
Local container throughput
131,799 TEU
199,873 TEU
−34.1%
Local traffic fell more sharply than the terminal's combined traffic.
Pier I operating revenue
€34.8M
€47.0M
−26.0%
Loss of handling income contributed significantly to the group's revenue decline.
Pier I pre-tax result
−€3.9M
+€6.5M
−€10.4M swing
Segment moved from profit to loss; figures rounded by company.
Pier I Q3 throughput growth
+524 TEU
Q3 2025
+0.3%
First positive quarterly year-on-year throughput reading of 2026.
Cruise operations | January–September
Total cruise passengers
1,264,350
1,561,854
−19.0%
297,504 fewer passenger movements.
Total cruise-ship calls
584
698
−16.3%
114 fewer calls, contributing to lower passenger volumes.
€15.90M less revenue using published exact amounts.
EBITDA
€92.62M
€111.50M
−16.9%
Earnings decline outpaced revenue contraction.
Net profit
€59.66M
€76.05M
−21.5%
€16.39M lower after-tax profit.
Investments
€126.6M
€68.6M
+84.5%
Capital investment expanded sharply despite weaker trading activity.
Financial position | September 30, 2026 vs December 31, 2025
Total borrowings
€139.2M
€60.8M
+129.1%
Debt rose as the company funded investments and other commitments.
Net cash / (net debt)
−€56.4M
+€89.0M
−€145.5M swing
Moved from positive net cash to net debt; dates are not year-on-year.
All figures come from PPA's November 3 nine-month financial disclosure. Segment figures have been rounded to €0.1M; exact group results are used where available. Operating comparisons use January–September 2025, while balance-sheet comparisons use December 31, 2025. The document is unaudited. Horizontal scrollbars are synchronized.
One Port, Two Very Different Container Businesses
The 27.8% volume reduction belongs to Pier I. PPA also earns substantial concession revenue from Piers II and III, which moved in the opposite financial direction.
Pier I | Direct operations€34.8M revenue
−26.0%
Revenue fell and pre-tax performance swung from a €6.5M profit to a €3.9M loss.
Piers II & III | Concession income€70.7M revenue
+3.2%
Concession revenue increased. Third-quarter growth in this revenue line reached 9% year on year.
The Financial Pressure Beneath the Recovery
Net cash position−€56.4M
The group moved into a net-debt position by September 30.
Investment spending€126.6M
Up 84.5% versus the corresponding nine months of 2025.
Available cash€82.7M
Down from €149.8M at December 31, 2025.
ShipUniverse Interactive | Port Recovery Scenario Tool
How Much Container & Cruise Traffic Must Piraeus Recover?
Reconstruct a nine-month operating scenario using actual 2026 traffic gaps and adjustable recovery assumptions. Test how much revenue and EBITDA might return, and compare the resulting financial profile against 2025.
Illustrative scenario
Recovery Assumptions
Reported benchmark: Pier I lost 152,061 TEU and cruise traffic lost 297,504 passenger movements against January–September 2025. PPA's nine-month revenue was €178.831M versus €194.735M in 2025. The simulator starts with those reported figures.
Pier I Container Recovery
100% represents recovery of the entire 152,061-TEU shortfall. Higher values model growth above the 2025 benchmark.
The revenue yield is an illustrative incremental rate, not an official terminal tariff or contract price.
Cruise Passenger Recovery
Cruise revenue includes business components that do not necessarily change in direct proportion to passenger traffic. The assumed yield simplifies those relationships.
Piers II & III Concession
Growth applies to the published €70.7M concession-revenue line, not to TEU volume at Piers II and III.
Additional Operating Pressure
Subtracts a discretionary cost allowance from the incremental EBITDA benefit.
Pro Forma Nine-Month Recovery
Modeled nine-month group revenue€193.38M
Reported 2026 group revenue plus selected improvements to Pier I, cruise and concession revenue. Other reported segments are held unchanged.
2025 Revenue Gap Recovered91.5%
Modeled incremental revenue divided by the actual nine-month revenue shortfall.
Additional Pier I TEU106,443
Port-call allocation and shipping rotations are not modeled.
Additional Cruise Passengers133,877
Recovery measured against the 2025 passenger benchmark.
Modeled Nine-Month EBITDA€98.61M
Uses user-defined incremental margins and overhead assumptions.
Revenue Recovery Bridge
Illustrative uplift from PPA's 2026 reported revenue, relative to the nine-month 2025 revenue benchmark.
2026 reported revenuePier I incremental revenueCruise incremental revenueConcession revenue change
Pier I additional revenue€0
Cruise additional revenue€0
Piers II & III revenue change€0
Total modeled revenue change€0
Revenue gap versus 2025€0
EBITDA gap versus 2025€0
At these cruise, concession and revenue-yield inputs80.5% Pier I recovery
Estimated Pier I TEU recovery needed to close the overall 2025 group-revenue gap, assuming all other inputs remain unchanged.
Pier I Recovery Sensitivity
The test below varies the percentage of missing Pier I TEU returned, while holding the selected cruise, concession and margin assumptions constant. Bars show additional modeled revenue, not total port revenue.
Pier I Recovery
Added Pier I TEU
Revenue Uplift
Pro Forma Revenue
Pro Forma EBITDA
Revenue Gap
What Could Change the Recovery?
Suez Route ReliabilityMore canal transits do not guarantee calls at Pier I. Carrier rotations and terminal allocation must be confirmed.
Cruise Homeport DeploymentPassenger volume depends on cruise schedules, itinerary demand and homeport assignments, not container routing.
Finance & Capital InvestmentHigher revenues do not automatically restore net profit or eliminate borrowing. Financing, taxes and investment spending remain separate.
Important modeling boundaries: This is a comparable nine-month revenue and EBITDA bridge, not an official PPA forecast for 2027. Actual reference data: Pier I's 152,061-TEU deficit, cruise passenger deficit of 297,504, 2026 revenue of €178,831,217, 2025 revenue of €194,735,470, 2026 EBITDA of €92,615,014, 2025 EBITDA of €111,500,713 and Piers II & III concession revenue of approximately €70.7M. Revenue yields, incremental margins, concession growth and additional costs are assumptions. The EBITDA calculation excludes changes in depreciation, financing, tax, other segment activity and unusual costs. A return to the 2025 benchmark is not guaranteed by any Suez reopening date.
Feedback Welcome
We welcome your feedback, suggestions, corrections, and ideas for enhancements.