
SHIPUNIVERSE
Maritime Intelligence, Tools & Live Industry Radars

One place for live maritime intelligence, practical decision tools, industry events and focused reporting.

17Live Radars 292Maritime Tools
24/7Intelligence Focus
GlobalIndustry Coverage
RADARS
TOOLS
All Tools
Latest 20
Open to load latest items…
NEWS
All News
Latest 20
Open to load latest items…
REPORTS
All Reports
Latest 20
Open to load latest items…
TECH
All Tech
Latest 20
Open to load latest items…
CRUISE
All Cruise
Latest 20
Open to load latest items…
NAVAL
All Naval
Latest 20
Open to load latest items…
SHIPUNIVERSE REPORTING

Reports, news and industry coverage

Full analysis in the ShipUniverse intelligence layout.

← Back to latest posts ShipUniverse / NEWS

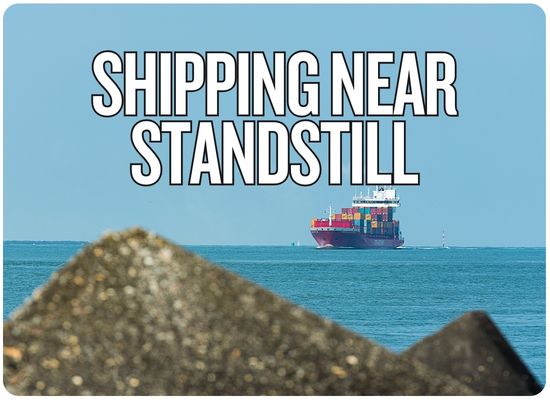
Hormuz Shipping Remains Near 90% Below Normal: Eight Ships Cross Sunday, Three Without AIS

🔔 Subscribe to ShipUniverse Weekly →

Only eight vessels crossed the Strait of Hormuz on November 1, 2026, according to maritime intelligence firm Windward, including three vessels operating without AIS signals. Four entered the Arabian Gulf and four departed, while GPS interference affected 478 vessels across the wider Gulf monitoring region. A separate AIS-only monitoring service recorded 10 commercial crossings that day against its pre-conflict baseline of 84.8 daily, indicating an approximately 88% reduction in detectable traffic. The two services use different vessel definitions and detection methods, but both establish that shipping remains severely restricted rather than completely stopped. Windward also reports that traffic held up despite fresh tanker attacks, with approximately 24 AIS-visible transits during the October 30–November 1 reporting window, compared with 18 in the preceding equivalent period.

ShipUniverse | Strait of Hormuz Traffic Watch

Eight Crossings. Three Dark. Shipping Far Below Normal.

The November 1 traffic picture reflects a deeply restricted waterway, not a confirmed day with zero vessel movements.

8Windward-recorded crossings, November 1
3Dark crossings in Windward's count
478Vessels affected by GPS jamming in wider monitored region
10Crossings recorded by a separate AIS-only monitor
Windward | November 1
8 transits
Inbound to Arabian Gulf4
Outbound toward Gulf of Oman4
Dark crossings identified3 of 8
Dark share of recorded total37.5%

Source: Windward daily intelligence, published November 2, using November 1 observations and reconstructions.

Independent AIS monitor | November 1
10 transits
Inbound commercial crossings6
Outbound commercial crossings4
2025/pre-crisis daily baseline84.8
Ships countedCommercial, 80m+

Source: hormuz.now. AIS-visible commercial vessels; does not reconstruct voyages made entirely without AIS.

Traffic compared with the pre-crisis baseline

Like-for-like figures from the independent AIS-visible commercial-ship monitor, not Windward's separate vessel universe.

84.8
10
88.2% below baseline

A vessel-count comparison, not an estimate of oil barrels or LNG cargoes lost.

Do not combine the counts: Windward includes analyst-reconstructed dark passages and uses its own detection and timing methods. The independent monitor counts AIS-visible commercial ships of at least 80 meters. The two totals are distinct measurements of the same operating environment, not numbers to add together.
ShipUniverse | Evidence & Energy Flow Board

A Vessel Crossing Is Not the Same as a Cargo Shipment

New ship-tracking observations, historical EIA commodity flows and recycled reporting must be evaluated on separate terms.

The evidence ledger

NOVEMBER DATA HISTORICAL CONTEXT MISDATED CLAIM
Source / period Reported number What it measures Treatment
WindwardNov. 1, 2026 8 crossings; 3 dark Four inbound and four outbound. Includes dark voyages identified by Windward's intelligence methods. CURRENT
hormuz.nowNov. 1, 2026 10 commercial crossings AIS-visible vessels at least 80 m; six inbound and four outbound. No dark-voyage reconstruction. CURRENT
WindwardOct. 30–Nov. 1 reporting window ~24 AIS-visible vs ~18 previously Two comparable reporting windows. Indicates traffic held up in this narrowly defined comparison. CURRENT
WindwardOct. 29 / Oct. 31 / Nov. 1 170 / 754 / 478 GPS-jammed vessels across the wider Gulf and Gulf of Oman monitoring region, not Strait crossing totals. CURRENT
Reuters / KplerAug. 15–16, 2026 5 Saturday; 0 Sunday; 31 prior weekend August commodity-vessel traffic. Originally reported by Reuters August 17; not October 31–November 1 observations. DO NOT REDATE
EIA / Vortexa4Q 2025 vs 2Q 2026 21.6 → 4.9 million b/d Quarterly estimated oil and petroleum-liquids throughput through Hormuz, not a November spot measurement. QUARTERLY
EIA / Vortexa4Q 2025 vs 2Q 2026 10.5 → 0.8 billion cf/d Estimated LNG flow through Hormuz during the respective quarters. QUARTERLY

Oil and petroleum liquids

Quarterly average, million barrels per day

21.64Q 2025
→
4.92Q 2026

About 77% lower than the fourth-quarter 2025 reference.

Liquefied natural gas

Quarterly average, billion cubic feet per day

10.54Q 2025
→
0.82Q 2026

About 92% lower than the fourth-quarter 2025 reference.

Do not convert a ship-count decline directly into missing barrels: empty and laden tankers, vessel size, dark movements, offshore transfers and pipelines change the relationship between crossings and export volumes.

Sources: Windward November 2 intelligence; hormuz.now November 1 traffic archive; Reuters August 17; U.S. EIA Global Energy Security Data, released August 12, 2026.

ShipUniverse | Interactive Maritime Disruption Tool

Hormuz Traffic Collapse & Fleet Exposure Tool

Model daily crossing shortfalls, vessel delays, and additional war-risk insurance exposure when commercial shipping through Hormuz remains severely restricted.

Adjust the scenario

Traffic conditions
AIS monitor pre-crisis reference.
November 1 AIS-only count.
Fleet disruption
Illustrative cost, not actual vessel hire.
Additional war-risk insurance
Hypothetical one-time rate per vessel.
Modeled total fleet exposure
$9.15M

Combined illustrative delay cost and one additional war-risk premium per vessel. Not an actual industry loss estimate.

Share of baseline traffic remaining 11.8%
10 observed 84.8 baseline
88.2% Decline from baseline crossings
74.8 Fewer detectable crossings per day
$3.15M Modeled fleet delay exposure
$6.00M Modeled extra war-risk premiums
$915K Combined exposure per vessel
70 Total additional vessel-delay days

Modeled cost breakdown

Fleet delay costs
$3.15M
Additional insurance
$6.00M
Total scenario exposure $9.15M
Traffic methodology: The daily baseline of 84.8 and observed count of 10 belong to the same AIS-visible commercial-vessel monitoring series. The difference represents fewer observed crossings, not a confirmed number of stranded ships or undelivered cargoes. AIS-dark crossings may not appear.
Financial assumptions: The selected affected-fleet size is independent of the traffic shortfall. Delay expense assumes the stated economic cost applies for each additional day. Insurance assumes one additional premium per vessel, calculated against entered hull value. Actual premiums, policy conditions, off-hire allocation, cargo costs, overlap between loss categories, and mitigation may differ substantially.

Traffic reference: November 1, 2026, AIS commercial-vessel monitor. All financial scenarios are illustrative ShipUniverse calculations, not verified losses or quotations for November 2.

Feedback Welcome

We welcome your feedback, suggestions, corrections, and ideas for enhancements.

Please click here to get in touch
By the ShipUniverse Editorial Team — About Us | Contact


← Browse more ShipUniverse posts
MARITIME DECISION TOOLS

Practical tools for real vessel and commercial decisions

Browse the latest 24 tools or instantly search every published ShipUniverse maritime tool.

24 latest toolsView all 292 →
TOOL

Maritime Counterparty Credit, Charter Hire Default, Payment Security & Recovery Exposure Tool

🔔 Subscribe to ShipUniverse Weekly → Charter Risk · Receivables ·…

Open →
TOOL

Cruise Ship Elevator Capacity, Passenger Flow, Outage Risk & Modernization ROI Tool

🔔 Subscribe to ShipUniverse Weekly → Cruise Operations · Hotel Engineering…

Open →
TOOL

Ship Lay-Up, Preservation, Reactivation & Return-to-Service Economics Tool

🔔 Subscribe to ShipUniverse Weekly → Shipowner Strategy · Vessel Preservation…

Open →
TOOL

Maritime Cyber Incident Recovery, OT Downtime, Business Interruption & Restoration Cost Tool

🔔 Subscribe to ShipUniverse Weekly → Maritime Cyber Resilience · Vessel…

Open →
TOOL

Vessel Technical Management Contract Tender, Fleet OPEX, Fees & SLA Comparison Tool

🔔 Subscribe to ShipUniverse Weekly → Ship Management · Fleet OPEX…

Open →
TOOL

Shipbuilding Refund Guarantee, Yard Credit Risk, Progress Payments & Delivery Default Tool

🔔 Subscribe to ShipUniverse Weekly → Shipbuilding Finance · Newbuilding Security…

Open →
TOOL

Port Waste Reception, MARPOL Delivery Notice, Disposal Logistics & Charge Verification Tool

🔔 Subscribe to ShipUniverse Weekly → Port Operations · MARPOL Waste…

Open →
TOOL

Maritime Crew Recruitment, Retention, Manning Agency Fees & Attrition Cost Tool

🔔 Subscribe to ShipUniverse Weekly → ShipUniverse · Fleet Crewing Economics…

Open →
TOOL

Container Rail Intermodal Connection, Terminal Dwell & Train Slot Tool

🔔 Subscribe to ShipUniverse Weekly → Ship-to-Rail · Intermodal Terminal ·…

Open →
TOOL

Bulk Grain Cargo Quality, Fumigation, Hold Readiness & Rejection Exposure Tool

🔔 Subscribe to ShipUniverse Weekly → Cargo quality · Hold inspection…

Open →
TOOL

Marine Equipment OEM Warranty, Service SLA & Repair Claim Tool

🔔 Subscribe to ShipUniverse Weekly → Equipment Reliability · OEM Claims…

Open →
TOOL

Freight Forwarder Shipment Quotation, Buy/Sell Rates, Routing & Margin Tool

🔔 Subscribe to ShipUniverse Weekly → Freight forwarding · NVOCC pricing…

Open →
TOOL

Ro-Ro Vehicle Terminal Yard Capacity, PDI & Vessel Loading Flow Tool

🔔 Subscribe to ShipUniverse Weekly → Vehicle terminals · PCTC &…

Open →
TOOL

Marine Hull & P&I Renewal, Premium Quote, Deductible & Coverage Comparison Tool

🔔 Subscribe to ShipUniverse Weekly → Marine Insurance · Renewal Tender…

Open →
TOOL

Offshore Support Vessel Charter Bid, Utilization & Campaign Profitability Tool

🔔 Subscribe to ShipUniverse Weekly → Offshore commercial operations · PSV…

Open →
TOOL

Marine Repair Tender, Shipyard Bid Comparison & Contract Cost Risk Tool

🔔 Subscribe to ShipUniverse Weekly → Ship Repair Procurement · Yard…

Open →
TOOL

Container Transshipment, Missed Connection, Rollover & Recovery Cost Tool

🔔 Subscribe to ShipUniverse Weekly → Container Liner Networks · Feeder-to-Mother…

Open →
TOOL

Vessel Pre-Purchase Technical Survey, Defect Valuation & Acquisition CAPEX Tool

🔔 Subscribe to ShipUniverse Weekly → Vessel S&P · Technical Due…

Open →
TOOL

Contract of Affreightment, Cargo Nomination, Fleet Allocation & Fulfilment Risk Tool

🔔 Subscribe to ShipUniverse Weekly → Dry Bulk Contracts · Cargo…

Open →
TOOL

Port Pilotage, Tug Dispatch, Berth Window & Marine Services Coordination Tool

🔔 Subscribe to ShipUniverse Weekly → Harbor Operations · Pilotage ·…

Open →
TOOL

Offshore Heavy Lift, Crane Spread, Weather Window & Installation Cost Tool

🔔 Subscribe to ShipUniverse Weekly → Offshore Construction · Heavy Lifts…

Open →
TOOL

Cruise Embarkation, Terminal Security, Gangway Queue & Passenger Processing Tool

🔔 Subscribe to ShipUniverse Weekly → Cruise Operations · Terminal Security…

Open →
TOOL

Dangerous Goods Declaration, Booking Acceptance & Documentation Readiness Tool

🔔 Subscribe to ShipUniverse Weekly → IMDG Documentation · Dangerous Goods…

Open →
TOOL

Marine Salvage, Wreck Removal, Pollution Response & Casualty Cost Tool

🔔 Subscribe to ShipUniverse Weekly → Marine Casualty · Emergency Salvage…

Open →