
🔔 Subscribe to ShipUniverse Weekly →
The Next 5% of Cruise Ship Efficiency Will Be Much Harder
Now it wants the half of the energy ships normally throw away.
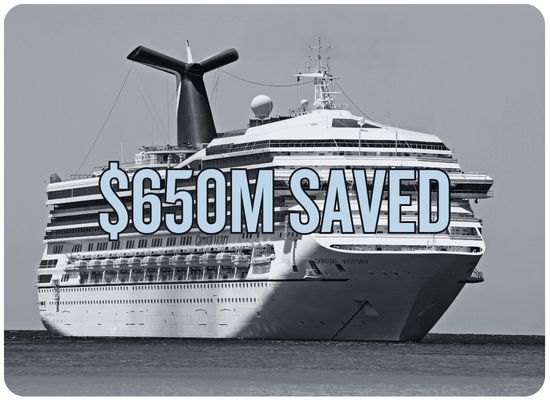
Carnival Corporation's efficiency program is on pace to save roughly $650 million during 2026 compared with the fuel consumption its fleet would have required at its 2019 baseline.
The next stage is harder. The company is looking deeper into engines, propulsion, hotel loads, air conditioning and waste heat for smaller increments that can become very large when multiplied across a global cruise fleet.
the lost half
The easiest fuel savings have already been harvested
Itinerary planning, speed management, HVAC automation, LED lighting, cleaner hulls, more efficient new ships and improved propulsion systems have pushed Carnival's fuel intensity sharply below 2019.
What remains is increasingly ship-specific engineering: low-grade heat recovery, smarter engine loading, improved cooling systems, digital twins, propulsion optimization and tighter integration between machinery and hotel systems.
One percentage point no longer sounds dramatic. Across Carnival's current fuel budget, it can represent more than $20 million a year.
The efficiency change since 2019 is enormous
Metric tons of fuel consumed per 1,000 available lower berth days.
Metric tons per 1,000 ALBDs using 2.7 million tons of full-year fuel guidance and 97.4 million forecast ALBDs.
That is roughly a 27% reduction in fuel intensity
If Carnival operated its forecast 2026 capacity at the 2019 fuel intensity, simple scaling implies fuel consumption of roughly 3.69 million metric tons.
Current guidance is approximately 2.7 million tons. The difference is close to one million metric tons of fuel.
This is a ShipUniverse cross-check using rounded reported figures, not Carnival's methodology for calculating its stated $650 million savings.
Where does the fuel actually go?
A representative marine diesel converts only about half of the chemical energy in its fuel into useful mechanical or electrical output. The remainder exits primarily as heat.
Illustrative 100-unit engine-energy balance synthesized from published marine-engine heat-balance research. It is not a measured Carnival fleet energy balance. Exact values vary materially by engine type, engine load, fuel, ambient conditions and auxiliary configuration.
Half the energy being "lost" does not mean half can be recovered
Heat has different quality. Hot exhaust gas can perform more useful work than relatively cool jacket water.
Recovery also requires a simultaneous use for the energy. A ship may have abundant engine heat at sea when a particular thermal demand is low, then need hot water or heating in port after the main propulsion demand has disappeared.
The engineering challenge is therefore not simply capturing heat. It is matching heat source, temperature, timing and onboard demand.
The cruise ship's second engine room is the hotel
Hotel-energy range
Cruise-energy research has found hotel systems can account for roughly 20% to 40% of total onboard energy use depending on ship design, climate and operating profile.
Carnival is attacking six different parts of the energy chain
HVAC automation, variable-speed equipment, LEDs and remote energy management reduce how much electricity the hotel side demands before another generator has to start.
Turbochargers, camshafts and fuel-injection modifications improve conversion efficiency at the source, making every downstream load cheaper to supply.
Air lubrication reduces friction beneath the hull so the same ship speed requires less propulsion power.
Absorption chillers can use otherwise rejected heat to produce chilled water, reducing the electrical demand of conventional chillers.
Hull coatings, robotic inspections, cleaning and thruster-grid improvements reduce resistance that otherwise accumulates silently between drydocks.
Weather routing, arrival-time optimization and shorter itinerary distances reduce the propulsion energy required before hardware changes are considered.
The biggest win so far is not propulsion
It is the hotel system
Carnival identifies its Power Saver Packs as its largest efficiency contributor to date. Instead of replacing the entire HVAC plant, the program changes how existing systems respond to real demand.
An empty theater demonstrates the logic
Carnival's decarbonization team has described the difference between continuously bringing in and cooling outside air and intelligently recirculating already-cooled air when a large room is empty.
The physical air-conditioning plant may already exist. The efficiency improvement can come from sensors, controls and software deciding when full capacity is actually necessary.
Waste heat is the next frontier
The unusual efficiency loop
Carnival has completed its first retrofit of an absorption chiller on a Carnival Cruise Line ship.
Instead of powering all cooling electrically, the system can use waste heat to create chilled water.
Engine burns fuel and produces mechanical or electrical power.
Exhaust and cooling circuits contain energy that would otherwise be rejected.
Heat is captured through a waste-heat system instead of being discarded.
Absorption equipment converts that thermal input into chilled water for HVAC.
Waste heat can do more than make electricity
| Recovered Energy Use | Energy Source | What It Displaces | Why Cruise Ships Are Interesting | Main Constraint |
|---|---|---|---|---|
| Steam | High-temperature exhaust heat | Auxiliary boiler fuel | Large continuous hot-water and hotel demands | Engine-load and steam-demand matching |
| Potable Water | Engine waste heat | Electrical or boiler energy used in water production | Thousands of passengers create major freshwater demand | Water-production schedule and port conditions |
| Electricity | High- and medium-temperature waste heat | Generator load | Hotel electrical demand exists almost continuously | Low conversion efficiency at lower temperatures |
| Chilled Water | Thermal energy through absorption chiller | Electric chiller compressor load | HVAC is a major cruise-ship energy consumer | Heat availability must coincide with cooling demand |
| Hot Water | Jacket water and lower-grade recovered heat | Boiler or electric heating | Cabins, galleys, laundry and spas require heat | Storage may be needed to bridge timing differences |
| Thermal Storage | Surplus heat while engines operate | Later boiler or electrical demand | Can shift recovered energy from sea operation into port periods | Tank volume, weight, retrofit space and economics |
The engine upgrade looks small until it runs 24 hours a day
Air lubrication attacks the problem before the propeller does
The propulsion plant cannot save energy that the hull has already wasted overcoming unnecessary friction.
Carnival has 13 ships operating with air-lubrication systems according to its latest sustainability disclosures, with more systems being installed or ordered. The technology creates a controlled carpet of bubbles beneath suitable sections of the hull and reduces propulsion energy by roughly 5% within the appropriate operating range.
Five percent of propulsion is not five percent of the entire ship
Air lubrication affects the energy required to move the hull. It does not directly eliminate galley electricity, cabin ventilation or lighting.
That distinction is why Carnival's efficiency strategy is becoming layered: hydrodynamic savings, engine savings and hotel savings can stack rather than duplicate one another.
What another 1%, 3%, 5% or 10% could be worth
The following sensitivity uses Carnival's current 2026 guidance of approximately 2.7 million metric tons of fuel, $768 per metric ton excluding emission allowances, and $2.25 billion of total fuel expense including emission allowances.
| Additional Efficiency | Fuel Avoided | Commodity Fuel Savings | All-In Fuel Expense Savings | Five-Year All-In Value | Interpretation |
|---|---|---|---|---|---|
| 1% | 27,000 t/year | ≈$20.7M | ≈$22.5M | ≈$112.5M | A seemingly small fleetwide improvement is already a nine-figure five-year opportunity. |
| 3% | 81,000 t/year | ≈$62.2M | ≈$67.5M | ≈$337.5M | Comparable with a major fleetwide retrofit program. |
| 5% | 135,000 t/year | ≈$103.7M | ≈$112.5M | ≈$562.5M | Roughly another half-billion dollars over five years before discounting. |
| 10% | 270,000 t/year | ≈$207.4M | ≈$225.0M | ≈$1.13B | An enormous target that would likely require multiple technologies and fleet renewal. |
The value of efficiency rises automatically when fuel gets expensive
A 5% fleetwide reduction equals approximately 135,000 metric tons on the current 2.7-million-ton guidance. The physical fuel saving stays the same. Its dollar value changes with bunker prices.
That is why consumption reduction behaves differently from fuel hedging
A lower bunker price reduces the cash value of each ton saved. A higher bunker price increases it.
But the physical efficiency remains on the ship across both environments. The same retrofit continues reducing the number of tons the operator needs to buy.
The next 5% will be harder than the previous 5%
Fleetwide Standardization
LEDs, HVAC controls, variable-speed equipment and obvious operational changes can be rolled through many ships with repeatable engineering packages.
Ship-Specific Optimization
Older ships have different engines, hull forms, electrical plants, itineraries, climates and hotel systems. Carnival is increasingly using digital models to decide which modification belongs on which ship.
Energy-System Integration
Waste heat, batteries, thermal storage, propulsion and hotel demand have to be managed as one system so savings in one subsystem do not simply create inefficiency somewhere else.
Efficiency is already offsetting a brutal fuel-price move
| Metric | 2025 / Prior Comparison | 2026 | Change / Meaning |
|---|---|---|---|
| 3Q Fuel Consumption / ALBD | 28.0 t / 1,000 ALBDs | 26.9 t / 1,000 ALBDs | 3.8% year-over-year efficiency improvement |
| 3Q Fuel Cost / Ton | $607 | $826 | Approximately 36% higher fuel price |
| Full-Year Fuel Consumption | 2.8M tons in FY2025 | ≈2.7M tons guidance | Lower absolute fuel despite modest capacity growth |
| Full-Year Fuel Price | $610/t in FY2025 | ≈$768/t guidance | Fuel price pressure increases the value of every efficiency project |
| Fuel Expense | Variable with fuel and emissions pricing | ≈$2.25B guidance | Large enough that another 1% is economically meaningful |
The technology with the best return may still be software
Carnival's strategy increasingly combines physical machinery with sensors and operating data.
Voyage optimization, weather forecasts, hull-condition monitoring, HVAC controls, engine data and digital twins can identify fuel losses without adding large pieces of machinery to every vessel.
Once the obvious hardware has been installed, better decisions about how existing equipment operates can become the next efficiency asset.
What is another 1%, 3%, 5% or 10% worth?
Start with Carnival's latest full-year 2026 guidance or replace the inputs with another fleet. The model separates physical fuel savings from direct bunker-cost savings and the broader all-in fuel-expense sensitivity.
Scenario model only. Carnival's stated $650 million 2026 savings versus 2019 is the company's own efficiency estimate and is not generated by this tool. The default 2.7 million metric tons, $768 per metric ton and $2.25 billion all-in fuel expense are Carnival's latest full-year 2026 guidance. The all-in expense includes emission allowances and may contain costs that do not move perfectly in proportion to fuel consumption, so the all-in savings figure is a sensitivity rather than accounting guidance. The model assumes efficiency improvements reduce fuel consumption directly and does not model capacity growth, rebound effects, changes in itinerary, LNG versus liquid-fuel mix, taxes, financing, maintenance costs or retrofit downtime.
We welcome your feedback, suggestions, corrections, and ideas for enhancements.
Please click here to get in touch