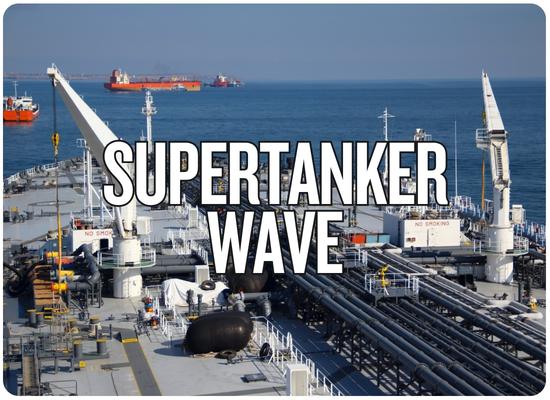
The VLCC market has created an unusual timing problem. Owners are ordering ships into one of the strongest tanker markets ever recorded, but most of those vessels will not reach the water until 2028 and 2029, when the disruptions generating today's extraordinary vessel demand may look completely different. Hartland Shipping now counts 319 VLCCs totaling 98.5 million dwt on order, equal to 34.2% of the existing fleet. Only 20 are due over the next six months. Then the curve turns sharply upward: 63 are scheduled during 2027, roughly 110 in 2028, and Hartland expects more than 100 again in 2029.
VLCC Supply Cycle · October 2026
The Delivery Cliff Is Still Two Years Away
Today's vessel shortage and tomorrow's vessel surplus can exist in the same market. Very few new VLCCs arrive immediately, while the giant order wave is concentrated in 2028 and 2029.
Current Orderbook319About 98.5 million dwt.
Orderbook / Fleet34.2%About 42% versus the non-sanctioned fleet.
Next 6 Months20Only around 6% of today's orderbook.
Fleet Age 15+47%The core argument for replacement.
VLCC Delivery Scale
1
2024
6
2025
63
2027
~110
2028
100+
2029
116
1974 Record
Why Owners Keep OrderingThe scarcity is real today.
Deliveries remain thin, geopolitical disruption is consuming vessel-days, and prompt VLCC capacity is earning exceptional money.
What Must Happen LaterOld ships must actually leave.
A large mature fleet exists, but replacement only prevents oversupply when older vessels are sold for recycling or permanently removed from mainstream trading.
1974 vs. 2028–29
The Similarity Is Supply. The Outcome Depends on Demand.
The 1970s provide a warning about timing, not a template. Today's mature fleet and sanctioned tonnage create far more potential replacement demand than existed during the original supertanker collapse.
1974–75The original supertanker bust
2028–29The approaching delivery wave
DELIVERY PEAK
116 VLCCs in 1974
Historical annual delivery record.
100+ in each year
Hartland expects 2028 and 2029 to approach 1970s-scale delivery volumes.
DEMAND SHOCK
Oil trade collapsed
The post-embargo demand shock hit after ships had already been ordered.
Demand path uncertain
Oil remains heavily traded, but long-term demand and tonne-mile forecasts vary widely.
ROUTE EFFICIENCY
Suez reopened
Shorter voyages reduced the amount of tanker capacity required per barrel moved.
Hormuz / Red Sea normalization?
Today's waiting, shuttling and detours support vessel demand. Normalization could reverse that.
FLEET AGE
Young ships were laid up
INTERTANKO counted 160 laid-up tankers under seven years old by end-1975.
47% already 15+
Today's fleet contains a much larger pool of obvious replacement candidates.
SCRAPPING
Lay-up became unavoidable
Hundreds of tankers had no profitable employment.
Only four VLCC demolitions
January through September 2026, despite the record contracting boom.
SUPPLY RISK100+ arrivalsOne year of 2028 deliveries alone is roughly 12% of today's VLCC fleet by vessel count.
SWING FACTORRoute normalizationThe current market is unusually dependent on inefficient Gulf and Red Sea logistics.
SAFETY VALVE438 mature shipsApproximate 15+ year pool implied by Hartland's fleet age and orderbook data.
CURRENT PROBLEMOwners won't scrapExceptional earnings make even elderly VLCCs unusually valuable today.
15-Year-Old VLCC~$163M
Current secondhand valuations reflect immediate access to extraordinary earnings.
VLCC Newbuilding~$141M
Cheaper on paper, but the owner may wait until 2029 for delivery and revenue.
Ship Universe VLCC Fleet Gate
How Many Old Tankers Must Leave to Absorb the 2028 Wave?
Instead of forecasting freight rates, this board tests the physical fleet balance. New ships enter through one side; retirements and tonne-mile growth must absorb them on the other.
Shipyard Gate
110
New VLCCs entering the fleet during the modeled year.
→FLEET GATE
Absorption Capacity
24
Retirements plus fleet-equivalent demand growth.
Unabsorbed Capacity Entering the Market86 ships
BalancedManageableHeavy supply pressure
Starting Fleet~933
Demand Absorption19 ships
Retirements Needed to Balance91 ships
Net Physical Fleet Change+105 ships
SUPPLY SHOCK
At the current demolition pace, modest demand growth would absorb only a small fraction of the projected 2028 deliveries.
Illustrative fleet-balance model, not a freight forecast. Starting fleet is approximately 933 vessels, derived from Hartland's 319-ship orderbook representing 34.2% of the fleet. Demand growth is translated into fleet-equivalent capacity for simplicity. Actual utilization is affected by speed, congestion, sanctions, ship-to-ship transfers, route distance, port delays, maintenance, storage and vessel suitability.
Feedback Welcome
We welcome your feedback, suggestions, corrections, and ideas for enhancements.