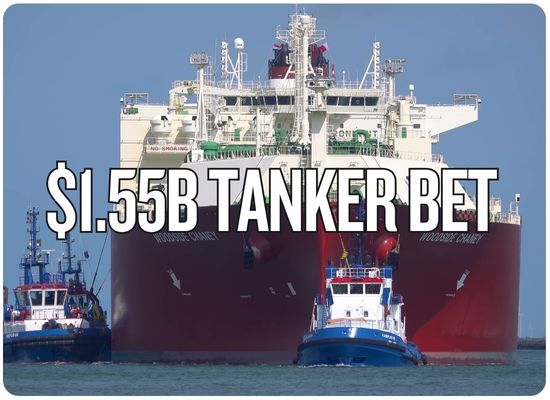
JPMorgan-linked shipping investment interests have reportedly expanded their very large crude carrier (VLCC) newbuilding program to 12 vessels worth approximately $1.55 billion, following a new two-tanker order at South Korea's Hanwha Ocean. The latest contract, signed October 29 and disclosed October 30, covers two VLCCs valued at KRW 356.8 billion, approximately $267 million, for delivery by September 2030. Hanwha's regulatory filing identifies the customer only as a Bermuda-based shipowner; the JPMorgan connection and 12-ship portfolio total were reported on November 2 by Splash247, citing shipbuilding sources. The investment comes as the tanker industry faces an unusual combination of exceptionally strong freight earnings, aging ships, changing crude trade routes and a VLCC orderbook already equivalent to approximately 38% of the operating fleet.
ShipUniverse | Institutional Tanker Capital
Twelve Supertankers. $1.55 Billion. Deliveries Stretching into 2030.
Shipbuilding sources link JPMorgan-backed investment interests to a major VLCC ordering campaign in China and South Korea. The latest pair is confirmed in a Korean shipyard filing, but the buyer's name is not disclosed in that filing.
Reported total program$1.55BEstimated value of 12 JPMorgan-linked VLCCs
VLCC newbuildings12Reported aggregate, not individually disclosed in one filing
Newest two ships$267MKRW356.8 billion confirmed shipyard contract
Latest delivery2030Contract period ends September 30
The Twelve-Ship Investment Position
Two highlighted vessels represent the latest Hanwha contract. The remaining ten represent the previously reported JPMorgan-linked program. Positions in this display are illustrative and do not identify specific hull numbers or assign yards to every ship.
April 2026 broker-reported order, approximately 307,000 dwt each. Two additional options were reported but are not counted as firm ships here. Deliveries anticipated in 2029.
$246MReported combined price
2VLCCs
Hanwha Ocean, South Korea
July 2026 contract, 320,000-dwt class, unnamed North American client in the public disclosure. Industry sources linked the order to JPMorgan. Delivery by March 2030.
$265MApproximate contract value
2VLCCs
Hanwha Ocean, South Korea
October 29 contract for an unnamed Bermuda-based owner. Signed value KRW356.8 billion. Contract completion by September 30, 2030.
$267MApproximate contract value
What Is Verified, and What Is Still Broker Attribution?
Shipyard-confirmed
The latest two-ship order, Korean-won contract value, Bermuda counterparty description, payment structure and September 2030 completion deadline.
Industry-reported
JPMorgan's beneficial connection to the newest buyer, the complete 12-VLCC program and approximately $1.55 billion aggregate investment.
Important: The three individually traceable tranches total approximately six ships and $778 million. The overall 12-ship, $1.55 billion figure comes from maritime trade reporting. The remaining six ships are not independently itemized here. Firm orders must not be combined with unexercised options, and the reported investment total is not proof that $1.55 billion has already been paid in cash.
ShipUniverse | VLCC Market Intelligence
The Problem With Buying for 2030: Today's Tankers Are Scarce, Tomorrow's May Not Be.
Record freight earnings and expensive secondhand tonnage make newbuilding contracts attractive. But a historic orderbook could change the economics long before the ships are delivered.
The Supply Pipeline Is Growing Faster Than the Fleet
Veson Nautical's September 2026 fleet comparison shows how significantly the VLCC orderbook expanded in just 12 months. The bars compare orderbook-to-operating-fleet ratios, not annual ship deliveries.
VLCC Orderbook / Operating Fleet
September 202515%
September 202638%
The ratio increased 23 percentage points. It does not mean 38% of the fleet will deliver in one year.
New VLCC Orders, Different Reporting Periods
Full year 2025, Signal Group93
2026 through September 17217
Reuters cited 217 year-to-date orders from Signal Group. Allied Shipbroking counted 164 over the same broad period, demonstrating that industry datasets differ.
Eight Data Points Behind the Investment Decision
These indicators combine confirmed shipbuilding orders, vessel valuations and shipping-industry research. Each has a different implication for a long-term investment underwriting case.
Indicator
Published Evidence
Supportive Interpretation
Downside / Alternative Explanation
Decision Implication
Evidence Category
VLCC Orderbook
Orderbook 38% of the operating fleet in September 2026 versus 15% in September 2025, according to Veson.
New ships will replace outdated vessels and increase commercial fleet quality.
Deliveries can exceed scrapping and effective demand growth if older ships remain active.
Underwrite 2030–2035 utilization at normalized rates, not only at current record earnings.
Supply risk
2026 Contracting Surge
Signal Group counted 217 VLCC orders by September 17, versus 93 in all of 2025. Different brokers count orders differently.
Owners are demonstrating confidence in long-distance crude transport.
Late-cycle contracting can increase future competition between new ships.
Model annual delivery waves and competing newbuilding supply.
Cycle sensitivity
Aging Existing Fleet
Approximately 20% of VLCCs are older than 20 years, according to Veson figures cited by Reuters.
Vessel replacement is a structural requirement, not entirely speculative demand.
Sanctioned or less-regulated trades can extend the commercial lives of older ships.
Separate gross new deliveries from net available fleet growth after retirements.
Replacement demand
Fifteen-Year-Old VLCC Values
At end-September, Veson valued a 15-year-old, 310,000-dwt VLCC at approximately $139.2M versus $138.7M for newbuilding tonnage.
Immediate vessel availability is highly valuable when freight earnings are exceptional.
The premium for existing ships may disappear when earnings normalize or vessels become available.
Do not extrapolate today's resale valuation into 2030 exit assumptions.
Asset-price risk
Five-Year-Old VLCC Values
Veson placed five-year-old VLCC values around $218M versus about $140.6M for newbuildings in its comparison.
Modern ships already in service command a large premium for immediate trading.
Investors buying newbuildings cannot capture that present premium until their ships deliver.
Apply a delivery-time discount and consider how quickly the valuation curve could revert.
Timing difference
Long-Haul Crude Growth
Reuters cited Vortexa's forecast of approximately 2.5M b/d of potential additional crude production from eastern South America through 2030.
Atlantic-to-Asia trades can support tanker demand through longer voyage distances.
Forecast production may not materialize, and routing or buyer patterns may change.
Model tonne-miles alongside crude barrels, not crude production alone.
Demand opportunity
Exceptional Freight Earnings
Reuters reported some VLCC spot earnings above $500K/day during the 2026 conflict; Veson documented unusually high time-charter rates.
Strong current earnings help explain why owners are competing for ships and yard slots.
Conflict-distorted spot rates are not sustainable base-case assumptions for a newbuilding arriving in 2030.
Test returns at $35K–$80K/day and distinguish fixtures from long-run estimates.
Earnings normalization
Hanwha 2026 Intake
21 VLCCs ordered at Hanwha Ocean in 2026, within a reported 44-vessel intake worth approximately $8.11B.
Premium South Korean construction capacity has strong buyer demand.
Limited yard and equipment capacity can increase scheduling and execution risk.
Scrutinize delivery guarantees, currency, milestone exposure and technical specifications.
Construction exposure
Important comparison limits: the 2026 ordering total is a September year-to-date observation; the 38% orderbook ratio is a September snapshot. Spot freight highs, one-year charter rates, asset valuation indices and newbuilding contract prices are separate market measures and should not be treated as interchangeable.
Three Different Investment Theses Could Explain the Same Order
JPMorgan has not disclosed the investment rationale or future employment arrangements for these 12 VLCCs in the source filings reviewed. These are alternative commercial explanations, not statements by the bank.
Thesis A
Longer Oil Voyages
Crude from the Americas increasingly reaches Asia by long-distance sea routes. VLCC demand can increase even if global oil consumption grows slowly, provided tonne-mile demand rises.
Thesis B
Fleet Renewal
Modern newbuildings could displace aging ships from mainstream, well-insured charter markets as operators pursue efficiency, compliance and cargo acceptance.
Thesis C
Secured Maritime Assets
An institutional investor can finance and own ships for long-term charterers rather than depend entirely on spot-rate speculation. Actual charter coverage for this program is undisclosed.
The investment decision is a timing problem: ships being ordered in 2026 will compete in a market shaped by 2029–2030 deliveries, scrapping, route changes and future oil demand. Today's unusually high rates provide context but do not reveal the earnings that the new hulls will actually achieve.
Can Twelve VLCCs Earn Back a $1.55 Billion Investment?
Build a leveraged tanker-ownership model covering steady earnings, debt repayment, daily cash break-even, debt-service coverage and future vessel resale value. The figures are scenarios, not JPMorgan's actual financing arrangements or charter contracts.
Select earnings case
Investment Assumptions
Published reference: maritime trade sources link JPMorgan interests to 12 VLCC newbuildings valued at approximately $1.55 billion. Every other financing, earnings, operating-cost and resale variable below is an editable example.
Fleet Acquisition
Long-Term Earnings
Time-charter-equivalent revenue net of voyage expenses, but before vessel operating expenses and debt service. Not a live 2026 fixture rate.
Allows for commercial downtime, maintenance and operational interruptions.
OPEX and reserve are applied for 365 calendar days each year. The reserve is treated as a cash allocation for maintenance and drydock needs.
Debt Financing
Asset Exit Scenario
Hypothetical fleet disposal proceeds after the selected holding period, before selling costs and debt repayment.
What Daily Earnings Must the Fleet Achieve?
Estimated cash break-even TCE / earning day$0/day
Average daily earnings required to cover the modeled fleet's operating costs, maintenance reserves and scheduled debt service. Excludes taxes and an additional return on shareholder equity.
Annual Equity Cash Yield0.0%
Annual cash to equity divided by initial equity investment.
Modeled Equity IRR0.0%
Includes annual equity cash flows and a modeled final vessel sale.
Initial Equity$0
Investment not funded by the assumed loan.
Exit Proceeds After Debt$0
Sale value after selling expenses and outstanding loan repayment.
Hypothetical Financing Structure
Debt: $0Equity: $0
Annual Fleet Cash Flow
Annual TCE revenue$0
Vessel operating expenses$0
Maintenance / drydock reserve$0
Operating cash before financing$0
Scheduled annual loan payment$0
Cash to equity after debt$0
VLCC Earnings Sensitivity
The chart shows how debt-service coverage changes at different sustained TCE levels. A ratio below 1.0 means operating cash is insufficient to cover scheduled debt service. The 1.2 threshold is an illustrative screening benchmark, not a lender covenant.
DSCR of 1.2× or higherDSCR below 1.2×
Fleet TCE / Day
Operating Cash
Debt Service
Annual Equity Cash
DSCR
Holding-Period Cash Flow & Debt Runoff
The model assumes the entire fleet starts earning at the same time and receives constant annual TCE. The actual reported newbuilding program has staggered deliveries, so this is a stabilized full-fleet scenario rather than a forecast of JPMorgan's calendar-year cash flows.
Operating Year
Operating Cash
Loan Payment
Equity Cash Flow
Loan Balance at Year-End
Assumptions and limitations: The 12-vessel, $1.55 billion investment is an industry-reported aggregate rather than a JPMorgan financial disclosure. Financing terms, contract-of-affreightment or time-charter coverage, actual vessel specifications, pre-delivery installments, construction interest, management fees, taxes, inflation, changes in TCE, residual values and investor distributions are unknown. This model starts when all selected vessels are operational, assumes annual fixed-rate amortizing debt and uses constant cash operating costs. Disposal value is a modeled assumption, not a forecast. IRR represents modeled equity cash flows, not a claimed JPMorgan return. Negative equity disposal proceeds indicate a shortfall requiring additional capital.
Feedback Welcome
We welcome your feedback, suggestions, corrections, and ideas for enhancements.