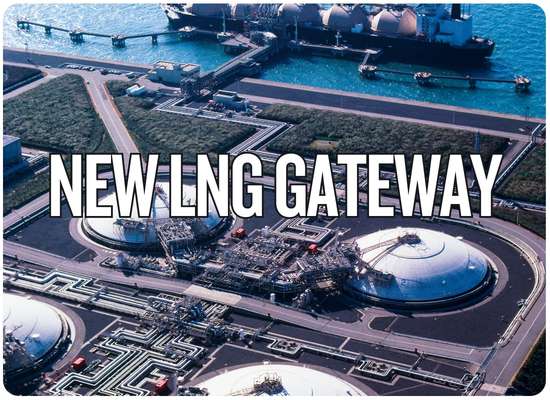
The U.S. Maritime Administration announced approval of ST LNG's deepwater port license application on October 28, 2026, advancing an estimated $8.2 billion liquefied natural gas export complex offshore Matagorda, Texas. The proposed facility would have four liquefaction systems with a combined capacity of 8.4 million tonnes annually, supported by 20 offshore platforms, four floating LNG storage units and four marine mooring systems. Construction is targeted for 2027, with initial operations planned for 2029. The project could eventually increase U.S. LNG export capacity by 7%–9%, according to the Department of Transportation, but the approval does not establish that financing, construction or commercial operations have been secured.
SHIPUNIVERSE / LNG INFRASTRUCTURE INTELLIGENCE
Four Offshore LNG Factories. One New Texas Export Gateway.
The approved application describes an offshore production and loading system built in four independently operating phases, with pipeline-fed liquefaction and dedicated floating storage.
MARAD APPLICATION APPROVEDOCT 28, 2026MATAGORDA, TEXAS
$8.2BReported project investment estimate
8.4MTonnes per year at full planned capacity
20Fixed platforms at full build-out
4Floating LNG storage units planned
01 / How the offshore export system would work
Texas Natural Gas SupplyTres Palacios / Williams Markham gas network Existing Transco infrastructure
5.6-mile proposed offshore lateral pipeline
PHASE 01
2.1 MTPALiquefaction
5 platforms 1 floating storage unit 1 mooring system
PHASE 02
2.1 MTPALiquefaction
5 platforms 1 floating storage unit 1 mooring system
PHASE 03
2.1 MTPALiquefaction
5 platforms 1 floating storage unit 1 mooring system
PHASE 04
2.1 MTPALiquefaction
5 platforms 1 floating storage unit 1 mooring system
Liquefied gas transferred into floating storage
LNG StorageFour floating storage units at full development
10.4 NMOffshore distance in federal and Texas regulatory filings, approximately 19.2 km
65–72 FTReported water depth at the offshore development site
7.7 MITotal proposed new pipeline length, including interconnecting lines between phases
Layout is schematic, not to scale. The 20 platforms include gas treatment, liquefaction, bridge support, LNG transfer, and accommodation/utilities structures across four phases. The October announcement describes full planned build-out, not equipment already installed or annual output already contracted.
SHIPUNIVERSE / REGULATORY DOCUMENT REVIEW
8.4 Million Tonnes. But How Many LNG Carrier Calls?
The terminal's maximum proposed production and the vessel-traffic assumptions in its public filings need to be examined together before estimating the shipping opportunity.
Maximum LNG carriers annually across four phases, according to the published Texas project description.
ShipUniverse / illustrative required loadings128
Approximate full loads at 8.4 MTPA, 146,000 m³ per carrier and 0.45 tonnes of LNG per m³.
Calculation: 8,400,000 tonnes ÷ (146,000 m³ × 0.45 tonnes/m³) = approximately 128 loaded voyages per year. At 100 comparable loads, carried volume is approximately 6.57 MTPA. Cargo density and actual carrier mix may differ. The project documents do not establish that this illustrative discrepancy represents an operational constraint.
The major development questions still open
Issue
Published evidence
Difference or remaining milestone
ShipUniverse commercial interpretation
TIMING First LNG
DOT October 28 announcement targets 2029. ST LNG's March 23 statement with Baker Hughes targeted Q2 2030.
The two published commissioning targets are not the same. No explanation reconciling them was identified.
LNG owners and charterers should not treat either projected date as a firm vessel-employment commencement date.
SHIP TRAFFIC Export calls
Texas notice describes up to 100 LNGC loadings/year. Federal Register cites an expected average 146,000 m³ carrier.
At 0.45 t/m³, 100 full average-size loads represent approximately 6.57 million tonnes.
Actual cargo scheduling will require clarification of vessel sizes, output rates, loading assumptions and possible updates to the marine traffic case.
EXPORT RIGHTS DOE authorization
DOE granted ST LNG long-term export authorization for FTA nations on April 22, 2026. The separate non-FTA request remains listed in its project docket without a corresponding approval entry.
MARAD port approval and DOE export authorization are distinct regulatory processes.
Export destination flexibility remains relevant to future buyers, contracts and route economics. Check subsequent DOE orders before assuming non-FTA rights.
CAPITAL Final Investment Decision
The March Baker Hughes announcement described ST LNG as progressing toward FID. October's DOT statement gives an $8.2bn investment estimate.
A disclosed total cost estimate is not evidence that the entire project is fully funded or sanctioned.
Financing, commercial commitments and execution contracts remain important indicators for shipowners and equipment providers.
PHASES Full build-out
Four individually functioning 2.1-MTPA phases with staggered construction. Twenty fixed platforms and four FSUs at full build-out.
Initial operation does not automatically unlock all 8.4 MTPA.
Additional carrier employment would emerge as exportable volumes grow, rather than necessarily appearing together at first LNG.
DISTANCE Offshore location
DOT press release uses 10.4 miles. Federal Register and Texas filing use 10.4 nautical miles, equivalent to 19.2 km.
Unit discrepancy between announcement and underlying regulatory descriptions.
Use the federal filing's nautical-mile measure when discussing the offshore location and marine planning.
The table distinguishes official statements and filed project assumptions from ShipUniverse calculations. It is not a finding that any license condition has been violated or that cargo production is impossible.
Four practical gates between approval and actual export traffic
01 / Marine approvalFavorable MARAD decision announced. Confirm final license issuance and any operating conditions.
02 / Commercial sanctionFinal investment approval, financing and cargo marketing commitments must support project execution.
03 / Offshore constructionPipeline, platforms, storage conversions, moorings, equipment and commissioning must be completed.
Bottom Line: MARAD's decision advances ST LNG's regulatory position. It does not by itself establish 8.4 MTPA of operational capacity, 100 or 128 actual annual cargoes, or a confirmed start date. Those outcomes depend on construction, operating performance, cargo density, vessel selection and further commercial milestones.
SHIPUNIVERSE INTERACTIVE TOOL / LNG SHIPPING
How Many LNG Carriers Would ST LNG Actually Need?
Adjust the number of operating phases, production utilization, carrier size and voyage cycle. The results show modeled annual LNG loadings and concurrent vessel demand, not confirmed future bookings.
SCENARIO PRESETS
Adjust the export scenario
The project is proposed in four independently operating 2.1-MTPA phases. Shipping variables are adjustable assumptions.
1 phase4 phases
2.1 million tonnes of nominal annual capacity per phase.
50%100%
Illustrative share of nominal liquefaction capacity actually produced and available for loading.
125,000 m³180,000 m³
The Federal Register identifies 146,000 m³ as the expected average carrier capacity.
0.420 t/m³0.480 t/m³
Modeling assumption. Actual mass per cubic meter depends on cargo composition and temperature.
85%100%
Share of stated vessel capacity allocated to the modeled cargo. The default is an idealized full load, not a normal loading guarantee.
20 days90 days
Entire sailing and turnaround cycle per export cargo, including return availability. No destination is assumed.
Modeled export loadings / year
128
Annual loaded LNG voyages required under the selected production and carrier assumptions. Rounded up to whole cargoes.
Annual LNG volume8.40M
Tonnes of hypothetical annual export output
Concurrent LNG carrier employment15 ships
Simple steady-state vessel-equivalent requirement
Compared with filed traffic assumption
ABOVE REFERENCE
Texas regulatory notice: 25 carrier loadings annually per phase, or 100 at full build-out.
Filed annual reference100 calls
Modeled annual loadings128 calls
At full nominal capacity, 146,000 m³ cargoes and 0.45 t/m³, the model requires about 128 annual loadings versus 100 in the published traffic scenario. Actual carrier size, utilization or other assumptions may reconcile the figures.
Tonnes per cargo = LNG carrier m³ × assumed density × effective fill
Loadings per year = ceiling(annual tonnes ÷ tonnes per cargo)
Vessel equivalents = ceiling(loadings per year × round-trip cycle days ÷ 365)
The comparison uses the published assumption of 25 annual carrier loadings per phase. This is an environmental/project-description traffic figure, not independently verified as a legally binding maximum or a forecast of actual cargo liftings. Carrier employment is a simplified steady-state estimate that assumes each modeled ship repeatedly serves the project, with no seasonal or scheduling buffer. It is not a firm charter demand forecast.
Production capability, marine traffic and vessel employment are different metrics. The model does not incorporate LNG quality limits, actual load factors, berthing availability, storage capacity, boil-off losses, fleet repositioning, destination-specific routes, bad-weather interruptions or future revisions to project filings.
Feedback Welcome
We welcome your feedback, suggestions, corrections, and ideas for enhancements.