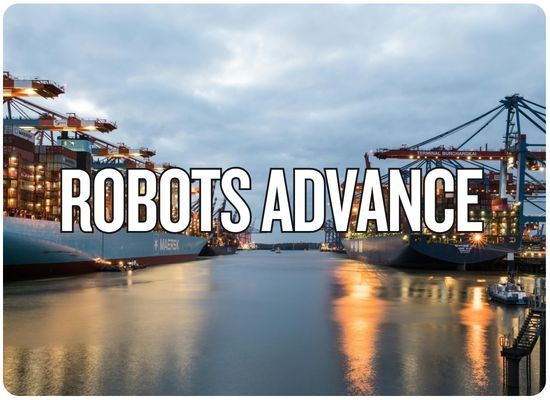
Cargill and Neptune Robotics announced an 18-month partnership on November 2, 2026, to test AI-enabled robotic hull cleaning, underwater inspection and fuel-efficiency monitoring on Cargill-operated vessels calling at the Port of Singapore. The programme, supported by Singapore's Maritime and Port Authority (MPA), will evaluate whether magnetic robotic cleaners using cavitation technology can remove marine growth while ships continue normal port operations, including cargo loading and discharge. Neptune already provides services across 61 ports in Singapore and China, while Cargill operates an average daily chartered fleet of approximately 600 vessels. The trial will test actual fuel savings, cleaning performance, coating protection and operational reliability, with the broader commercial objective of making hull maintenance a routine port-call service rather than an additional interruption to vessel schedules.
ShipUniverse | Maritime Technology | November 2026
The Hull Cleaning Robot Joins the Cargo Shift
Cargill and Neptune will test whether an underwater
maintenance service can run alongside normal port
operations, while producing measurable fuel savings
on later voyages.
Partnership Duration
18 Months
Announced November 2, 2026
Provider Footprint
61 Ports
Neptune-reported service coverage
MPA Technology Partners
6
Selected for Singapore innovation trials
Programme R&D Funding
S$3.7M
Approximate co-funding across six partners
Two Operations, One Port Call
Conceptual vessel-side view. MAGNETO is an existing
commercial system; concurrent working conditions
and compliance are evaluated case by case.
ABOVE WATERLINE
Cargo Continues Moving
Loading, discharge, bunkering or
other scheduled port activities
proceed where simultaneous work is permitted.
Cargill-Operated Vessel
Hull AlongsideNo dedicated cleaning-only stop in the ideal case
R
MAGNETO ROV
Magnetic traction on suitable hull surfaces;
cavitation jets remove marine growth.
Below the Waterline
The robot traverses the submerged hull,
inspecting and cleaning selected surfaces.
Coating integrity, difficult geometries and
debris control remain critical safeguards.
Underwater hull work is not performed while a ship
is sailing at sea. The proposed operational benefit
is cleaning during an existing port stay or anchorage,
not cleaning a vessel underway.
From Fouling Detection to Verified Savings
The trial must connect robot activity with
subsequent ship-performance measurements.
01 / INSPECT
Measure Hull Condition
Record marine growth, coating condition
and baseline underwater imagery.
02 / CLEAN
Remove Biofouling
Run the robotic system under approved
environmental and operational conditions.
03 / VERIFY
Document the Surface
Confirm coverage, fouling removal
and any coating damage or missed areas.
04 / MEASURE
Compare Fuel Performance
Normalize voyage data for speed, draft,
weather and other operating differences.
Already Commercially Demonstrated
Neptune operates robotic cleaning services,
including work during cargo operations.
Cargill and Neptune have collaborated
for more than four years.
Still Being Established
Repeatable fuel savings across Cargill
voyages, environmental performance,
AI-assisted inspection reliability
and scalability under Singapore
operating constraints.
ShipUniverse | Engineering & Operational Evidence
Five Gates Between a Robot Demo and a Fleet Programme
Removing fouling is only the first step.
The technology must work within port
restrictions, protect coatings, produce
reliable measurements and earn enough
fuel savings to justify repeated deployment.
The Commercial Readiness Gates
Requirements and evaluations derived from
Singapore's MPA innovation programme.
The statuses indicate outstanding validation,
not a failure finding against any provider.
01
Prove Cleaning Coverage
Inspect and clean flat plating, curved bow areas,
bilge keels and relevant niche areas.
Document any inaccessible surfaces.
Trial Evidence Needed
02
Protect Paint and Manage Debris
Demonstrate coating compatibility, waste capture,
filtration and environmentally responsible disposal.
Environmental Validation
03
Operate Around Cargo Work
Maintain safe clearance from vessel operations
and prove reliability under currents,
confined spaces and varying water visibility.
Port-Call Trials
04
Measure Fuel Performance
Compare before-and-after propulsion performance
at equivalent operating conditions rather
than treating lower bunker consumption alone
as proof of cleaning savings.
Voyage Data Required
05
Make Repetition Economical
Test service frequency, annual costs,
port availability and whether savings
persist across multiple voyages.
Business Case Open
The Trial Measurement Board
What ship operators should require from a
repeatable robotic maintenance service.
These are validation criteria, not
published final results from Cargill's trial.
Test
Data to Collect
Performance Question
Possible Failure Mode
Research Basis
Hull Condition
Fouling classification, georeferenced
imagery, surface coverage and
post-cleaning observations.
How much of the hull is actually
clean after each intervention?
Missed regions or inconsistent
fouling assessment.
MPA / IMO
Waste Capture
Captured debris, filtration performance
and waste-treatment records.
Does cleaning avoid unacceptable
release of organisms and contaminants?
Incomplete capture or unsuitable
effluent treatment.
MPA / MEPC.1/Circ.918
Coating Integrity
Before-and-after coating inspection,
observed damage and wear history.
Can frequent cleaning preserve
anti-fouling coating life?
Coating wear erodes the
economic or environmental advantage.
IMO Guidance
Operating Window
Cleaning hours, berth availability,
delays and concurrent activities.
Can the work fit inside
existing port time?
Added port hours or incompatible
cargo and safety procedures.
MPA Trial Scope
Fuel Performance
Speed through water, power,
draft, trim, weather and fuel use.
Does normalized propulsion demand
fall after cleaning?
Route, weather or speed differences
mistaken for fuel savings.
ISO 19030
Fleet Economics
Cleaning fees, retained savings,
service interval and party paying
for bunkers.
Does the programme generate net
value for the party funding it?
Fuel savings too small or
incentives split across contracts.
Commercial Assessment
MPA's programme specifies filtration of captured
particulate material to less than 10 micrometers.
This is a target for system verification, not
an assertion that all currently marketed robots
meet that specification.
A Lower Fuel Bill Is Not Enough Evidence
ISO 19030 provides a framework for measuring
changes in hull and propeller performance
on the same ship over time.
Unadjusted Comparison
Fuel consumption fell from one voyage
to the next. The second voyage may
also have had lower speed, less cargo,
better weather or different currents.
The improvement cannot automatically
be attributed to hull cleaning.
Useful Engineering Evidence
Compare propulsion performance under
equivalent speed, draft, trim and
environmental conditions. Record
coating condition and inspect again
later to measure how long any
improvement persists.
What Routine Robotics Could Replace
Some diver-assisted hull cleaning,
separate cleaning-only port stops,
manual inspection work and
reactive fouling interventions,
subject to vessel and port suitability.
What It Does Not Replace
Statutory drydocking and surveys,
structural steel repair, major
coating renewal, damaged appendage
repairs or other work that requires
the vessel to leave the water.
The scale test:
If routine underwater cleaning can reliably
fit inside existing port stays and deliver
independently measurable fuel improvements,
it could become a standard operating expense.
If environmental compliance, coating wear or
inconsistent savings add cost, the service
remains a more selective maintenance option.
ShipUniverse Interactive Vessel Efficiency Tool
When Does Robotic Hull Cleaning Pay for Itself?
Calculate annual fuel savings, cleaning expenses,
vessel-time costs and estimated CO2 reductions.
Test whether routine robotic maintenance can be
profitable without adding a separate port stop.
Trial results are not yet available.
All fuel reductions, service prices, port hours
and cleaning frequencies are illustrative inputs.
This tool does not represent Cargill's actual
trial performance or a Neptune price quotation.
1. Vessel Fuel Performance
Start with normal annual fuel use and
the percentage reduction expected from
a routine hull maintenance programme.
The retention factor accounts for
savings being lower over time than
immediately after cleaning.
Daily sea-going consumption before new programme
Sailing days to which fuel reduction applies
Assumed programme benefit, not a verified claim
Accounts for fouling returning between cleanings
Illustrative fuel procurement price
Identical-vessel illustration for fleet scaling
2. Cleaning and Port-Call Economics
Check whether cleaning fits inside the existing
service window. Additional port hours are
calculated only when the assumed cleaning
duration exceeds available concurrent time.
Illustrative maintenance frequency
Assumed all-in cleaning service fee
Cleaning time for the selected vessel
Time available without delaying vessel departure
Assumed incremental cost of additional port time
Extra Hours per Cleaning
0.0 h
Time beyond the available
concurrent service window.
Annual Extra Port-Time Cost / Vessel
$0
Additional time-related expense,
assuming the operation cannot be rescheduled.
Where the Annual Fuel Savings Go
Red shows cleaning and incremental port-time
costs. Green shows the remaining net benefit.
If costs exceed savings, the cost segment
fills the bar and net benefit becomes negative.
Annual Programme Cost / Vessel
$54,000
Net Annual Benefit / Vessel
+$123,905
Baseline Annual Fuel / Vessel
6,440 t
Fuel consumption before the
assumed cleaning programme.
Effective Annual Fuel Reduction
4.25%
Initial improvement adjusted by
the savings-retention assumption.
Annual Fuel Saved / Vessel
273.7 t
Estimated reduction in fuel consumption
during selected sea days.
Gross Annual Fuel Savings / Vessel
$177,905
Value of fuel saved before
cleaning and time-related expenses.
Net Annual Benefit / Vessel
$123,905
Gross savings less routine
cleaning and added port-time costs.
Estimated CO2 Avoided / Vessel
852 t
Tank-to-wake combustion estimate using
3.114 t CO2 per tonne of HFO-equivalent fuel.
Break-Even Initial Fuel Reduction
1.52%
Minimum initial fuel reduction required
under the selected retention and cost assumptions.
Break-Even Fee per Cleaning
$59,302
Maximum cleaning fee for zero net benefit
at the selected savings level, after time costs.
Combined Annual Fleet Benefit
$123,905
Per-vessel modeled net benefit multiplied
by the selected vessel count.
The Cleaning Programme Is Economically Positive
Under the selected assumptions, fuel savings
exceed annual cleaning and vessel-time costs.
Adjust the inputs to test your operating profile.
Calculation method:
Baseline annual fuel equals daily sea-going
consumption multiplied by annual sea days.
Effective annual fuel reduction equals the
selected initial percentage saving multiplied
by the average savings-retention factor.
This is an annualized assumption, not a
measured fouling-growth curve.
Fuel saved equals baseline fuel multiplied
by effective reduction. Gross financial
benefit equals fuel saved multiplied
by bunker price.
Additional hours per cleaning equal the
greater of zero and cleaning duration
minus concurrent port hours.
Incremental annual port-time cost equals
additional hours / 24 multiplied by
daily vessel cost and number of cleanings.
Annual programme cost equals cleaning
frequency multiplied by service fee,
plus incremental port-time costs.
Net benefit equals gross fuel savings
minus programme costs.
Break-even initial fuel reduction equals
annual programme costs divided by
baseline annual fuel cost and the
retention factor. The model reports
N/A when this cannot be calculated.
Break-even fee per cleaning is the
remaining gross fuel benefit after
incremental time costs, divided by
the number of annual cleaning jobs.
A negative value indicates that even
free cleaning would not offset time costs.
Avoided CO2 uses an illustrative
heavy-fuel-oil combustion factor
of 3.114 tonnes CO2 per tonne of fuel.
It excludes upstream fuel emissions,
robot energy consumption, waste disposal
and lifecycle impacts.
All vessels in a multi-vessel scenario
are assumed to share identical fuel use,
operating days, maintenance costs and savings.
Scope limitations:
The model does not account for weather,
vessel draft, speed changes, hull coating
life, unmeasured fouling, drydock obligations,
charterparty allocation of expenses,
financing, taxes or regulatory carbon costs.
It does not automatically assume that more
frequent cleaning increases fuel savings.
Users must adjust the expected average
fuel benefit and retention factor to
reflect the selected programme.
All inputs are illustrative.
Positive financial results are not
verified trial outcomes or guaranteed returns.
USD throughout.
Feedback Welcome
We welcome your feedback, suggestions, corrections, and ideas for enhancements.