
SHIPUNIVERSE
Maritime Intelligence, Tools & Live Industry Radars

One place for live maritime intelligence, practical decision tools, industry events and focused reporting.

17Live Radars 290Maritime Tools
24/7Intelligence Focus
GlobalIndustry Coverage
RADARS
TOOLS
All Tools
Latest 20
Open to load latest items…
NEWS
All News
Latest 20
Open to load latest items…
REPORTS
All Reports
Latest 20
Open to load latest items…
TECH
All Tech
Latest 20
Open to load latest items…
CRUISE
All Cruise
Latest 20
Open to load latest items…
NAVAL
All Naval
Latest 20
Open to load latest items…
SHIPUNIVERSE REPORTING

Reports, news and industry coverage

Full analysis in the ShipUniverse intelligence layout.

← Back to latest posts ShipUniverse / NEWS

Maersk Is Sending Another Service Back Through Suez. What Happens to Freight Rates When the Long Detour Ends?

🔔 Subscribe to ShipUniverse Weekly →

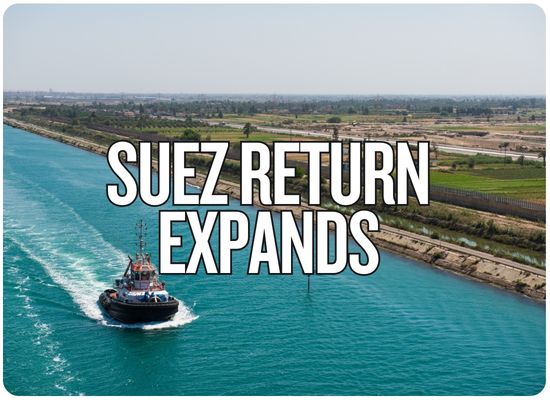
Maersk and Hapag-Lloyd announced on November 2, 2026, that their joint ME1 container service connecting India and Northern Europe will return to the Suez Canal, ending its longer routing around Africa's Cape of Good Hope. The change begins with Atlanta Express, voyage 644W, scheduled to depart Salalah on November 4, followed by Savannah Express, voyage 644E, departing Tangier on November 13. The move adds another service to the carriers' gradual Red Sea return, at a time when Drewry reports the highest weekly Suez container-ship transit count of 2026 and freight markets are already confronting excess-capacity concerns. Shorter voyages could reduce fuel consumption and free vessels previously tied up by the African detour, although Maersk and Hapag-Lloyd say further routing decisions remain dependent on security conditions in the Red Sea.

ShipUniverse | Red Sea Routing Intelligence

ME1 Leaves the Cape Detour Behind

The India–Europe service is scheduled to return through Suez in both directions, beginning with designated November voyages.

ANNOUNCED 02 NOV 2026 STATUS PLANNED TRANSITION OPERATORS MAERSK + HAPAG-LLOYD

The Distance Advantage

Illustrative Mundra–Rotterdam direct port-pair comparison at 14 knots. Excludes the additional ME1 port calls, waiting time and operational buffers.

Previous Route Via Cape of Good Hope
INDIA
Southern Africa
Cape detour
NORTHERN EUROPE
One-Way Distance11,060 nm
Days at Sea32.9
New Route Via Red Sea + Suez Canal
INDIA
Bab el-Mandeb
Suez Canal
NORTHERN EUROPE
One-Way Distance6,382 nm
Days at Sea19.0
Illustrative One-Way Distance Avoided 4,678 nm
Illustrative Sailing Time Saved 13.9 days

Official ME1 Port Rotation

The following sequence is Maersk's published November 2 rotation. Highlighted steps indicate canal passages.

Mundra› Nhava Sheva› Salalah› Suez Canal› Tangier› Rotterdam› Wilhelmshaven› Hamburg› London› Algeciras› Tangier› Suez Canal› Salalah› Mundra
First Westbound Change ATLANTA EXPRESS

Voyage 644W
Last call: Salalah
ETD: 4 November 2026

First Eastbound Change SAVANNAH EXPRESS

Voyage 644E
Last call: Tangier
ETD: 13 November 2026

Security condition: The revised routing remains subject to Red Sea stability. The November departure dates are published schedule triggers, not confirmed canal transits. Faster transit on a direct port pair does not guarantee the same reduction in a multi-port service schedule.
Sources: Maersk ME1 advisory, November 2, 2026; VesselVector estimated Mundra–Rotterdam sea distances. The distance/time comparison is illustrative route modeling, not a Maersk service-speed commitment.
ShipUniverse | Container Capacity Intelligence

The Fleet Capacity Hidden Inside the Long Detour

A shorter route can restore vessel availability without a single additional ship being delivered. Whether that capacity reaches the market depends on carrier deployment decisions.

281 Containership transits through Suez during the four weeks examined by Lloyd's List Intelligence on October 29.
3.0M TEU Nominal vessel capacity represented by those transits, not loaded cargo volume.
62 Weekly Suez vessel transits in Drewry's latest October 29 container-market tracking.
How a Return to Suez Can Affect Freight Supply
Step 01 Shorter Rotation

Less time at sea on the same geographic trade, provided port calls and operational buffers are comparable.

→
Step 02 Fewer Ship-Days

Maintaining weekly departures can require fewer deployed vessels, allowing a smaller operating fleet.

→
Step 03 Market Capacity Decision

Vessels may be redeployed, redelivered, reserved or used to improve schedule reliability.

Critical distinction: Released fleet capacity is not automatically additional weekly cargo capacity on ME1.

Six Variables That Determine the Freight-Rate Outcome

The routing decision is confirmed. Its commercial consequences depend on factors that remain partly unreported or outside the operators' direct control.

↔ Scroll using either synchronized horizontal bar.
Market Variable Current Evidence Potential Commercial Effect Next Measurement to Watch
ME1 Deployment Both directions have scheduled November transition vessels. Maersk has published the revised port rotation. Shorter sailing distances can reduce voyage time and potentially lower the number of required vessels. Actual transits, revised port-to-port schedules and the number of ships assigned to ME1.
Suez Traffic Lloyd's List Intelligence recorded 281 containership passages over four weeks, representing 3M TEU of nominal capacity. Increasing Suez utilization indicates a broader return, but traffic counts alone do not quantify released fleet capacity. Weekly ship transits, vessel sizes and capacity-weighted routing changes.
Fleet Reallocation No specific ME1 fleet-reduction or redeployment total was disclosed in the November 2 advisory. Redeliveries can reduce charter demand; redeployment could add shipping slots on other services. Vessel redeployments, charter extensions, idle tonnage and blank sailings.
Freight Pricing Drewry's October 29 WCI was $4,429 per FEU. Shanghai–Rotterdam stood at $3,686 per FEU. Additional effective supply can pressure spot freight if cargo demand and carrier capacity management do not offset it. India–Europe freight quotes, FAK announcements, shipment volumes and weekly trade-specific indices.
Transit Economics Drewry's different 24,000-TEU service comparison estimated ~$1M of round-voyage saving before war-risk costs. Lower time and bunker expense can improve vessel economics; canal tolls and insurance can counteract savings. Actual Suez dues, insurance quotations, fuel prices and vessel fuel consumption.
Security / Reliability The return remains conditional on security. Gemini's September schedule reliability was 68.4%, according to Sea-Intelligence data reported by Seatrade. Further disruptions may require extra sailing buffers or renewed diversion, offsetting expected capacity gains. Security advisories, on-time arrivals, carrier routing changes and schedule revisions.
The rate-pressure condition: Freight rates face additional downward pressure if more ship capacity becomes commercially available while cargo demand remains insufficient to absorb it. That outcome is not guaranteed by ME1's route change alone, particularly if carriers withdraw excess ships, adjust sailing frequency or rebuild schedule buffers.
Research basis: Maersk November 2 advisory; Lloyd's List Intelligence October 29 Red Sea Brief; Drewry October 29 WCI; Drewry's October Suez analysis; Sea-Intelligence September schedule-reliability statistics as reported October 29. Observed figures, historical estimates and prospective consequences are intentionally separated.
ShipUniverse Interactive Tool | Suez Economics

How Many Ships Could a Suez Return Release?

Stress-test a weekly India–Europe container service. Change speed, service frequency and operating costs, then examine a separate hypothetical freight-rate movement.

Vessel & Route Inputs

Illustrative port pair: Mundra–Rotterdam. The model assumes the same simplified port-pair voyage is repeated in both directions.

14 kn
10 knots20 knots
10,000 TEU
4,000 TEU24,000 TEU
1
1 weekly4 weekly
12 days
0 days35 days
65 t
25 t/day150 t/day
$650
$350/t$1,000/t
Modeled Operational Effects
Potential Vessels Released from Weekly Rotation
4 ships

Difference between rounded vessel requirements for a weekly service using the Cape and Suez routes. These are theoretical fleet-equivalent positions, not verified ME1 vessel releases.

Required Vessels Via Cape 12
Required Vessels Via Suez 8
Cape Round-Trip Cycle 77.8 days
Suez Round-Trip Cycle 50.0 days
Round-Trip Sea Days Avoided 27.8 days
Nominal Fleet Capacity Potentially Released 40,000 TEU
Fuel Avoided per Round Trip 1,810 t
Fuel Cost Avoided per Round Trip $1.18M
Added Suez & Risk Charges per Round Trip $1.00M
Net Modeled Voyage Variable-Cost Saving $0.18M
The modeled shorter route requires fewer ships to maintain weekly departures, but the net voyage cost advantage is partly absorbed by canal and security charges.

Round-Trip Service Days

The bars combine modeled sailing days with identical port and schedule buffers. Suez includes one additional round-trip day for canal waiting as an explicit assumption.

Cape of Good Hope77.8 days
Suez Canal50.0 days

Freight-Rate Stress Test

This is a separate spot-market scenario. It is not a forecast of freight changes caused by the ME1 decision.

−5%
−25%+25%
Modeled Weekly Freight Revenue / Cost Change
−$75,000

A 5% decline at the assumed $3,000 spot rate changes the freight value of 500 spot-exposed FEUs by $75,000 per week. This does not predict actual rate movements.

Methodology and limitations

Route-distance assumptions: 6,382 nm via Suez and 11,060 nm via the Cape, from the VesselVector Mundra–Rotterdam port-pair model. Both directions use the same simplified distances. Sea days equal distance divided by speed and 24 hours. Round-trip cycle equals twice the one-way sea days plus selected port/buffer days. The Suez cycle additionally includes one assumed day of canal waiting in total. This is not Maersk's published ME1 schedule.

Vessel requirements equal the rounded-up number of ships needed to sustain the selected weekly departures, based on round-trip cycle days. The difference is a theoretical vessel count; it does not establish that the carrier will remove or redeploy those vessels. Nominal TEU released equals the vessel-count difference multiplied by selected ship capacity. It is not weekly cargo throughput, available booking capacity or a reported Gemini fleet change.

Fuel avoided equals the difference in sea days multiplied by selected tonnes per sailing day. Added Suez costs include two assumed toll amounts and two assumed war-risk costs per round trip. Net variable-cost advantage equals avoided sailing fuel cost minus those incremental charges. The model excludes canal transit fuel, auxiliary fuel during waits, crew, vessel hire, charter savings, emissions levies, maintenance, cargo handling, actual insurance terms and fuel consumption changes with speed. The assumed daily fuel consumption is held fixed when changing speed for simplicity; real fuel consumption depends strongly on speed and engine load.

Freight-rate sensitivity equals the assumed weekly spot-exposed FEU count multiplied by the selected starting rate and hypothetical percentage change. It is independent of the vessel-capacity calculation. Rates may change for many reasons besides Suez routing. No cargo insurance, war-risk surcharge or carrier-specific quotation is implied by the default $3,000/FEU assumption.

Feedback Welcome

We welcome your feedback, suggestions, corrections, and ideas for enhancements.

Please click here to get in touch
By the ShipUniverse Editorial Team — About Us | Contact


← Browse more ShipUniverse posts
MARITIME DECISION TOOLS

Practical tools for real vessel and commercial decisions

Browse the latest 24 tools or instantly search every published ShipUniverse maritime tool.

24 latest toolsView all 290 →
TOOL

Ship Lay-Up, Preservation, Reactivation & Return-to-Service Economics Tool

🔔 Subscribe to ShipUniverse Weekly → Shipowner Strategy · Vessel Preservation…

Open →
TOOL

Maritime Cyber Incident Recovery, OT Downtime, Business Interruption & Restoration Cost Tool

🔔 Subscribe to ShipUniverse Weekly → Maritime Cyber Resilience · Vessel…

Open →
TOOL

Vessel Technical Management Contract Tender, Fleet OPEX, Fees & SLA Comparison Tool

🔔 Subscribe to ShipUniverse Weekly → Ship Management · Fleet OPEX…

Open →
TOOL

Shipbuilding Refund Guarantee, Yard Credit Risk, Progress Payments & Delivery Default Tool

🔔 Subscribe to ShipUniverse Weekly → Shipbuilding Finance · Newbuilding Security…

Open →
TOOL

Port Waste Reception, MARPOL Delivery Notice, Disposal Logistics & Charge Verification Tool

🔔 Subscribe to ShipUniverse Weekly → Port Operations · MARPOL Waste…

Open →
TOOL

Maritime Crew Recruitment, Retention, Manning Agency Fees & Attrition Cost Tool

🔔 Subscribe to ShipUniverse Weekly → ShipUniverse · Fleet Crewing Economics…

Open →
TOOL

Container Rail Intermodal Connection, Terminal Dwell & Train Slot Tool

🔔 Subscribe to ShipUniverse Weekly → Ship-to-Rail · Intermodal Terminal ·…

Open →
TOOL

Bulk Grain Cargo Quality, Fumigation, Hold Readiness & Rejection Exposure Tool

🔔 Subscribe to ShipUniverse Weekly → Cargo quality · Hold inspection…

Open →
TOOL

Marine Equipment OEM Warranty, Service SLA & Repair Claim Tool

🔔 Subscribe to ShipUniverse Weekly → Equipment Reliability · OEM Claims…

Open →
TOOL

Freight Forwarder Shipment Quotation, Buy/Sell Rates, Routing & Margin Tool

🔔 Subscribe to ShipUniverse Weekly → Freight forwarding · NVOCC pricing…

Open →
TOOL

Ro-Ro Vehicle Terminal Yard Capacity, PDI & Vessel Loading Flow Tool

🔔 Subscribe to ShipUniverse Weekly → Vehicle terminals · PCTC &…

Open →
TOOL

Marine Hull & P&I Renewal, Premium Quote, Deductible & Coverage Comparison Tool

🔔 Subscribe to ShipUniverse Weekly → Marine Insurance · Renewal Tender…

Open →
TOOL

Offshore Support Vessel Charter Bid, Utilization & Campaign Profitability Tool

🔔 Subscribe to ShipUniverse Weekly → Offshore commercial operations · PSV…

Open →
TOOL

Marine Repair Tender, Shipyard Bid Comparison & Contract Cost Risk Tool

🔔 Subscribe to ShipUniverse Weekly → Ship Repair Procurement · Yard…

Open →
TOOL

Container Transshipment, Missed Connection, Rollover & Recovery Cost Tool

🔔 Subscribe to ShipUniverse Weekly → Container Liner Networks · Feeder-to-Mother…

Open →
TOOL

Vessel Pre-Purchase Technical Survey, Defect Valuation & Acquisition CAPEX Tool

🔔 Subscribe to ShipUniverse Weekly → Vessel S&P · Technical Due…

Open →
TOOL

Contract of Affreightment, Cargo Nomination, Fleet Allocation & Fulfilment Risk Tool

🔔 Subscribe to ShipUniverse Weekly → Dry Bulk Contracts · Cargo…

Open →
TOOL

Port Pilotage, Tug Dispatch, Berth Window & Marine Services Coordination Tool

🔔 Subscribe to ShipUniverse Weekly → Harbor Operations · Pilotage ·…

Open →
TOOL

Offshore Heavy Lift, Crane Spread, Weather Window & Installation Cost Tool

🔔 Subscribe to ShipUniverse Weekly → Offshore Construction · Heavy Lifts…

Open →
TOOL

Cruise Embarkation, Terminal Security, Gangway Queue & Passenger Processing Tool

🔔 Subscribe to ShipUniverse Weekly → Cruise Operations · Terminal Security…

Open →
TOOL

Dangerous Goods Declaration, Booking Acceptance & Documentation Readiness Tool

🔔 Subscribe to ShipUniverse Weekly → IMDG Documentation · Dangerous Goods…

Open →
TOOL

Marine Salvage, Wreck Removal, Pollution Response & Casualty Cost Tool

🔔 Subscribe to ShipUniverse Weekly → Marine Casualty · Emergency Salvage…

Open →
TOOL

Ferry Route Capacity, Timetable Reliability & Passenger Revenue Tool

🔔 Subscribe to ShipUniverse Weekly → Ferry Networks · Route Planning…

Open →
TOOL

Inland Barge Tow, Lock Delay, Fleet Utilization & Voyage Profitability Tool

🔔 Subscribe to ShipUniverse Weekly → Inland Navigation • Towboat Economics…

Open →