
🔔 Subscribe to ShipUniverse Weekly →
China Builds 2.35× America's Naval Tonnage: 10 Numbers Behind the Gap
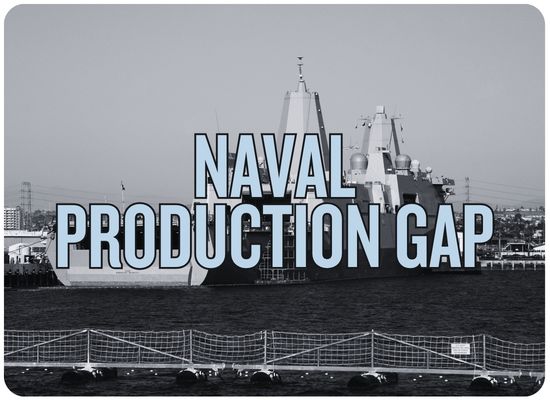
If you've spent time around shipyards, you know the difference between a ship on order and a ship coming down the ways. China's production figures have moved beyond ambition. Over two years, its yards delivered more than twice the naval tonnage of America's. The U.S. still has the heavier fleet. The worry is how much faster the other side can keep adding steel.
delivered naval tonnage
10 figures that explain the gap
Different measures tell different stories: completed vessels, shipyard output, the fleet already at sea and the industrial base behind it.
Five reasons this is difficult to reverse
| Production lever | Chinese position | American constraint / decision point |
|---|---|---|
| Shipyard network | Jiangnan, Dalian and Hudong-Zhonghua combine naval production with substantial commercial-building activity. | Newport News, Electric Boat, Bath and Ingalls handle highly specialized fleets; a few constrained yards carry much of the work. |
| Merchant-ship scale | Commercial orders sustain fabrication, block assembly, purchasing networks and a wider labor pool. | The U.S. has little equivalent deep-sea merchant-building volume to spread fixed costs and develop capacity. |
| Design repetition | Repeat runs of Type 052D and other established designs support learning across successive hulls. | Design changes and incomplete drawings, including the frigate program, have contributed to delay and rework. |
| Skilled trades | A larger commercial/naval ecosystem offers more continuous demand for specialist production skills. | GAO identifies persistent recruitment, training and retention pressure for welders, pipefitters and machinists. |
| Build cadence | Multiple vessel classes move through large production systems in parallel. | Long schedules and component bottlenecks keep funded destroyers and submarines in yards for years longer than planned. |
Read the measures correctly. Euronaval production counts military, paramilitary and auxiliary deliveries above 200 tonnes, including vessels made for export. The active-fleet figure covers a different population: in-service combat ships. Commercial shares are measured in merchant gross tonnage, not naval displacement. None of these figures measures combat effectiveness, readiness, missile capacity or wartime replacement speed.
Research sources and methodology
Euronaval, World Defense Shipbuilding 2026 (pp. 6–7, 18–25, 54–59): naval deliveries, counts, production value and fleet tonnage. Figures compiled by Flottes de Combat / GICAN.
Congressional Research Service, August 2026 and CSIS: merchant-shipbuilding market share and dual-use industry.
GAO, April 2026: Navy shipbuilding capacity, trades and design execution.
Congressional Budget Office, August 2026: destroyer funding-to-delivery times and industrial workload.
CSIS, March 2025: dual-use yards, commercial orders and industrial infrastructure.
Percent change and production-gap calculations are derived from reported totals. The Euronaval production-value figure of approximately $46.0B for China is distinct from its approximately $43.5B acquisitions figure.
What would it take to close the annual output gap?
Start with the 2024–25 average: 135,255 t/year for the U.S. and 318,104 t/year for China. Change annual production growth and see how the two building programs diverge or converge.
Modeled cumulative deliveries: calculating…
Illustration only, not a shipbuilding or fleet forecast. Growth compounds from two-year historical averages. No retirements, losses, procurement constraints, design complexity or combat effectiveness are modeled.
We welcome your feedback, suggestions, corrections, and ideas for enhancements.
Please click here to get in touch