
SHIPUNIVERSE
Maritime Intelligence, Tools & Live Industry Radars

One place for live maritime intelligence, practical decision tools, industry events and focused reporting.

17Live Radars 295Maritime Tools
24/7Intelligence Focus
GlobalIndustry Coverage
RADARS
TOOLS
All Tools
Latest 20
Open to load latest items…
NEWS
All News
Latest 20
Open to load latest items…
REPORTS
All Reports
Latest 20
Open to load latest items…
TECH
All Tech
Latest 20
Open to load latest items…
CRUISE
All Cruise
Latest 20
Open to load latest items…
NAVAL
All Naval
Latest 20
Open to load latest items…
SHIPUNIVERSE REPORTING

Reports, news and industry coverage

Full analysis in the ShipUniverse intelligence layout.

← Back to latest posts ShipUniverse / NEWS

India’s Adani Is Buying Into Europe’s Energy Ports for $2.9 Billion. A New Global Terminal Powerhouse Is Emerging.

🔔 Subscribe to ShipUniverse Weekly →

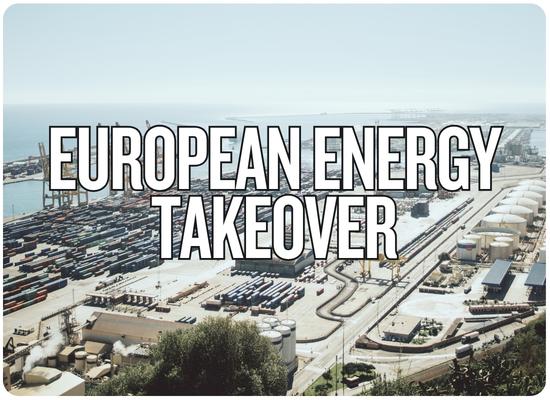
India's Adani Ports and Special Economic Zone (APSEZ) has agreed to acquire Dutch liquid-storage operator Evos for an enterprise value of €2.56 billion, approximately $2.88 billion, in a transaction announced November 5, 2026. The agreement would give Adani control of eight storage terminals across the Netherlands, Belgium, Germany, Spain and Malta, representing 6.3 million cubic metres of capacity, 452 storage tanks and 63 ship and barge berths. Evos handled 37 million tonnes of liquid cargo in 2025 and generated €219 million in EBITDA, with a reported 99% average commercial occupancy rate. The transaction would make Adani a major participant in Europe's petroleum, chemical and alternative-fuel storage infrastructure, but ownership has not yet transferred: regulatory approvals and employee works-council consultations remain outstanding.

ShipUniverse | Global Energy-Terminal M&A

€2.56 Billion.
Eight Terminals.
One European Energy Network.

Adani Ports has signed an agreement to acquire Evos, a liquid-storage platform serving European energy traders, industrial groups, fuel distributors and maritime transport customers.
6.3m m³
Storage capacity

Across eight tank terminals in five European countries

99%
Commercial occupancy

Reported portfolio average, not necessarily physical tank fill

€219m
2025 EBITDA

56% margin on €392 million in annual revenue

What the announced purchase price includes
Total enterprise value€2.558bn
€1.184bn Equity purchase consideration, before adjustments
€1.374bn Implied net debt and debt-like items in the enterprise-to-equity bridge
2025 financial profile and transaction economics
11.7× Enterprise value / 2025 EBITDA
€406 Enterprise value per cubic metre of installed storage capacity
37m Tonnes of liquid cargo handled in 2025
2.76× Estimated combined post-transaction net debt / EBITDA
Agreement signed. Completion still pending.
01 / Approval Applicable regulatory and other approvals must be obtained.
02 / Consultation Employee works-council consultation remains part of the process.
03 / Financing Debt financing planned; MUFG commitments of up to €2.8bn disclosed.
Data source: APSEZ November 5, 2026 announcement and exchange-filing investor materials. Calculated EV per m³ uses €2,558m / 6.3m m³. The deal is not complete, and enterprise value must not be mistaken for the equity cheque or annual revenue.
ShipUniverse | European Liquid Terminal Footprint

Eight Terminals at Europe's Energy Crossroads

The assets connect tankers and inland barges with pipelines, industrial customers, airports and fuel distribution markets. Filter the locations to compare Northwest European and Mediterranean capacity.

452Storage tanks distributed across the network
63Combined ship and inland-barge berths, not 63 deepwater tanker berths
37m tLiquid cargo throughput in calendar 2025
Terminal-level capacity and logistics
Entire acquired network6.30m m³
Storage capacities are rounded from the acquisition investor presentation. Use either scrollbar to explore every column.
TerminalCapacityTanksBerths (ship + barge)Principal cargo / activityStrategic role
Amsterdam East
Netherlands
1.70m m³
907 + 9 Gasoline blending components, diesel, jet fuel, biofuels Major ARA storage asset with pipeline access to Schiphol airport and related fuel-distribution systems.
Amsterdam West
Netherlands
1.22m m³
414 + 10 Gasoline components and diesel Large import, export and regional barge-distribution storage within the ARA market.
Ghent
Belgium
0.93m m³
622 + 4 Marine fuels, chemicals, diesel and transition-fuel services North Sea Port location linked to ship, barge, rail, truck and pipeline logistics.
Hamburg
Germany
0.68m m³
1515 + 4 Marine fuels, diesel, chemicals, biofuels Numerous smaller tanks support diverse industrial and regional distribution requirements.
Malta 0.57m m³
253 + 1 Bunkering hubFuel oil, marine gasoil, gasoline Central Mediterranean bunker storage, blending and ship-to-ship transfer services.
Terneuzen
Netherlands
0.54m m³
403 + 3 Chemicals Specialized industrial liquid storage with multimodal marine and inland connectivity.
Algeciras
Spain
0.40m m³
222 + 2 Bunkering hubMarine fuels, gasoil, methanol-capable storage Strait of Gibraltar energy trading and bunker supply, including large-vessel and barge access.
Rotterdam
Netherlands
0.26m m³
212 + 2 Expansion underwayChemicals, methanol, ethanol, biofuels Europoort liquids site with a five-tank methanol and ethanol expansion initiated in March 2026.
CONTINUED TABLE / HORIZONTAL SCROLL
2025 revenue composition / Reported product categories
31%Gasoline
22%Chemicals
21%Marine fuels / fuel oil
9%Gasoil / diesel
9%Biofuels
4%Jet fuel
3%Sustainable aviation fuel
~1%Rounding / other categories
These percentages describe revenue by product category, not the contents of every tank or the share of handling volume. The disclosed category percentages are rounded.
Sources: APSEZ November 5 investor presentation, Evos's terminal information and 2024 sustainability report. The Evos corporate website currently describes approximately 6.4m m³, while the acquisition disclosures use 6.3m m³; the graphic follows the acquisition basis. Storage figures are not annual tonne-throughput capacity.
ShipUniverse Interactive Tool | Energy Terminal M&A

Evos Acquisition Economics: What Could Improve the Return?

Stress-test the €2.56bn enterprise valuation against contracted occupancy, tariff repricing, value-added terminal services, debt cost and an illustrative five-year upgrade program.

01 / Operating scenarios
02 / Disclosed acquisition baseline
03 / Operating improvements or downside
04 / Financing and upgrade economics
Illustrative interest-bearing amount
Model logic: Existing revenue moves proportionally with modeled commercial occupancy and tariff changes. Additional services revenue is layered on separately. The selected incremental EBITDA margin applies only to changes from 2025 revenue. This is a simplified scenario, not Evos's contract-specific pricing structure or management guidance. The investment NPV below concerns a hypothetical incremental upgrade program, not the overall acquisition.
05 / Modeled annual operating economics
Scenario annual EBITDA
€236.4m

Includes hypothetical operating improvements above reported 2025 EBITDA.

€418.8mScenario annual revenue
56.5%Scenario EBITDA margin
10.82×EV / scenario annual EBITDA
+€17.4mAnnual EBITDA change from 2025
€406/m³Enterprise value per installed m³
€53.3mIllustrative annual interest on modeled acquisition borrowing only

Reported EBITDA Versus Scenario

2025 reported EBITDA€219.0m
Scenario annual EBITDA€236.4m
An illustrative future earnings comparison. It does not establish post-acquisition revenue or returns.
Incremental program NPV / selected horizon
€30.6m

Discounted modeled incremental EBITDA less the hypothetical upfront upgrade investment. Excludes tax, working capital, maintenance differences and financing effects. This is not the €2.56bn purchase's NPV.

Borrowing Cost Sensitivity

Hold the modeled acquisition borrowing constant. These are hypothetical financing costs, not an assertion that all of MUFG's €2.8bn commitments will be drawn.

3.5% interest€41.4mAnnual interest expense
4.5% interest€53.3mAnnual interest expense
6.0% interest€71.0mAnnual interest expense

Discounted Incremental Earnings Schedule

A year-by-year illustration of the additional EBITDA generated by the modeled operating improvement. Cumulative discounted value starts after deducting the one-time hypothetical upgrade investment.

YearIncremental EBITDADiscount factorDiscounted EBITDACumulative NPV
Glossary and methodology: 12 important terms
Enterprise value
Equity value plus net debt and debt-like adjustments, representing a transaction-level value of the operating business.
Equity value
Value attributed to shares being purchased, subject to agreement and closing adjustments.
EBITDA
Earnings before interest, tax, depreciation and amortization, not net profit or distributable cash.
EV/EBITDA
Enterprise value divided by annual EBITDA, a valuation multiple that ignores differences in capital expenditure and financing.
Commercial occupancy
Percentage of storage capacity commercially contracted or otherwise occupied under the operator's reported measure, not necessarily physical fill.
Take-or-pay
A contract structure requiring payment for agreed capacity or service even when actual use is below a specified commitment.
CPI indexation
Contract pricing linked to a consumer-price measure under agreed terms.
Incremental EBITDA margin
Share of modeled additional revenue assumed to reach EBITDA, rather than the historical portfolio margin.
Capacity turnover
Number of inventory cycles through storage, which requires density, working-capacity and throughput definitions for meaningful measurement.
Financing interest
Cost of the amount actually assumed borrowed; the acquisition's financing commitments are not automatically debt drawn.
Discount rate
Annual rate used to convert future modeled benefits to present value.
Net present value
Discounted future benefits less modeled upfront investment, here limited to an incremental terminal improvement program.
ShipUniverse financial disclaimer: Reported 2025 Evos figures are the starting baseline. All scenario improvements, borrowing utilization, interest rates, upgrade investment, incremental EBITDA margins, growth rates and discount rates are assumptions. The model excludes taxes, working capital, existing Evos borrowing costs, lease obligations, depreciation, environmental liabilities, maintenance variations and other costs not entered. It does not calculate transaction net profit, complete acquisition free cash flow, regulatory approval probability or an investment recommendation. EBITDA is not the same as cash flow.
Feedback Welcome

We welcome your feedback, suggestions, corrections, and ideas for enhancements.

Please click here to get in touch
By the ShipUniverse Editorial Team — About Us | Contact


← Browse more ShipUniverse posts
MARITIME DECISION TOOLS

Practical tools for real vessel and commercial decisions

Browse the latest 24 tools or instantly search every published ShipUniverse maritime tool.

24 latest toolsView all 295 →
TOOL

Container Shipping Service Contract, Minimum Volume Commitment, Carrier Allocation & Shortfall Cost Tool

🔔 Subscribe to ShipUniverse Weekly → SHIPUNIVERSE / OCEAN FREIGHT PROCUREMENT…

Open →
TOOL

Fleet Retrofit CAPEX Prioritization, Fuel Savings, Decarbonization & Capital Allocation Tool

🔔 Subscribe to ShipUniverse Weekly → SHIP UNIVERSE / FLEET CAPITAL…

Open →
TOOL

Port Container Crane Fleet Replacement,Availability & Lifecycle CAPEX ROI Tool

🔔 Subscribe to ShipUniverse Weekly → SHIP UNIVERSE / TERMINAL ASSET…

Open →
TOOL

Maritime Counterparty Credit, Charter Hire Default, Payment Security & Recovery Exposure Tool

🔔 Subscribe to ShipUniverse Weekly → Charter Risk · Receivables ·…

Open →
TOOL

Cruise Ship Elevator Capacity, Passenger Flow, Outage Risk & Modernization ROI Tool

🔔 Subscribe to ShipUniverse Weekly → Cruise Operations · Hotel Engineering…

Open →
TOOL

Ship Lay-Up, Preservation, Reactivation & Return-to-Service Economics Tool

🔔 Subscribe to ShipUniverse Weekly → Shipowner Strategy · Vessel Preservation…

Open →
TOOL

Maritime Cyber Incident Recovery, OT Downtime, Business Interruption & Restoration Cost Tool

🔔 Subscribe to ShipUniverse Weekly → Maritime Cyber Resilience · Vessel…

Open →
TOOL

Vessel Technical Management Contract Tender, Fleet OPEX, Fees & SLA Comparison Tool

🔔 Subscribe to ShipUniverse Weekly → Ship Management · Fleet OPEX…

Open →
TOOL

Shipbuilding Refund Guarantee, Yard Credit Risk, Progress Payments & Delivery Default Tool

🔔 Subscribe to ShipUniverse Weekly → Shipbuilding Finance · Newbuilding Security…

Open →
TOOL

Port Waste Reception, MARPOL Delivery Notice, Disposal Logistics & Charge Verification Tool

🔔 Subscribe to ShipUniverse Weekly → Port Operations · MARPOL Waste…

Open →
TOOL

Maritime Crew Recruitment, Retention, Manning Agency Fees & Attrition Cost Tool

🔔 Subscribe to ShipUniverse Weekly → ShipUniverse · Fleet Crewing Economics…

Open →
TOOL

Container Rail Intermodal Connection, Terminal Dwell & Train Slot Tool

🔔 Subscribe to ShipUniverse Weekly → Ship-to-Rail · Intermodal Terminal ·…

Open →
TOOL

Bulk Grain Cargo Quality, Fumigation, Hold Readiness & Rejection Exposure Tool

🔔 Subscribe to ShipUniverse Weekly → Cargo quality · Hold inspection…

Open →
TOOL

Marine Equipment OEM Warranty, Service SLA & Repair Claim Tool

🔔 Subscribe to ShipUniverse Weekly → Equipment Reliability · OEM Claims…

Open →
TOOL

Freight Forwarder Shipment Quotation, Buy/Sell Rates, Routing & Margin Tool

🔔 Subscribe to ShipUniverse Weekly → Freight forwarding · NVOCC pricing…

Open →
TOOL

Ro-Ro Vehicle Terminal Yard Capacity, PDI & Vessel Loading Flow Tool

🔔 Subscribe to ShipUniverse Weekly → Vehicle terminals · PCTC &…

Open →
TOOL

Marine Hull & P&I Renewal, Premium Quote, Deductible & Coverage Comparison Tool

🔔 Subscribe to ShipUniverse Weekly → Marine Insurance · Renewal Tender…

Open →
TOOL

Offshore Support Vessel Charter Bid, Utilization & Campaign Profitability Tool

🔔 Subscribe to ShipUniverse Weekly → Offshore commercial operations · PSV…

Open →
TOOL

Marine Repair Tender, Shipyard Bid Comparison & Contract Cost Risk Tool

🔔 Subscribe to ShipUniverse Weekly → Ship Repair Procurement · Yard…

Open →
TOOL

Container Transshipment, Missed Connection, Rollover & Recovery Cost Tool

🔔 Subscribe to ShipUniverse Weekly → Container Liner Networks · Feeder-to-Mother…

Open →
TOOL

Vessel Pre-Purchase Technical Survey, Defect Valuation & Acquisition CAPEX Tool

🔔 Subscribe to ShipUniverse Weekly → Vessel S&P · Technical Due…

Open →
TOOL

Contract of Affreightment, Cargo Nomination, Fleet Allocation & Fulfilment Risk Tool

🔔 Subscribe to ShipUniverse Weekly → Dry Bulk Contracts · Cargo…

Open →
TOOL

Port Pilotage, Tug Dispatch, Berth Window & Marine Services Coordination Tool

🔔 Subscribe to ShipUniverse Weekly → Harbor Operations · Pilotage ·…

Open →
TOOL

Offshore Heavy Lift, Crane Spread, Weather Window & Installation Cost Tool

🔔 Subscribe to ShipUniverse Weekly → Offshore Construction · Heavy Lifts…

Open →