
SHIPUNIVERSE
Maritime Intelligence, Tools & Live Industry Radars

One place for live maritime intelligence, practical decision tools, industry events and focused reporting.

17Live Radars 282Maritime Tools
24/7Intelligence Focus
GlobalIndustry Coverage
RADARS
TOOLS
All Tools
Latest 20
Open to load latest items…
NEWS
All News
Latest 20
Open to load latest items…
REPORTS
All Reports
Latest 20
Open to load latest items…
TECH
All Tech
Latest 20
Open to load latest items…
CRUISE
All Cruise
Latest 20
Open to load latest items…
NAVAL
All Naval
Latest 20
Open to load latest items…
SHIPUNIVERSE REPORTING

Reports, news and industry coverage

Full analysis in the ShipUniverse intelligence layout.

← Back to latest posts ShipUniverse / NEWS

Drewry WCI Rises Again as U.S.-Bound Container Rates Break Higher

🔔 Subscribe to ShipUniverse Weekly →

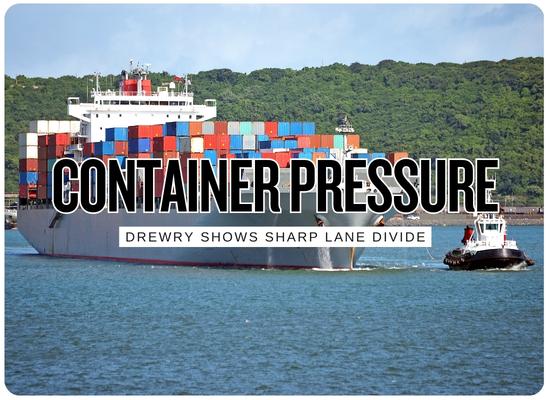
Drewry’s latest World Container Index rose 1% on August 13 to $4,339 per 40ft container, marking the second consecutive weekly increase after the late-July slide. The headline gain was driven by U.S.-bound Transpacific pricing, with Shanghai to New York jumping 10% to $8,706 and Shanghai to Los Angeles rising 6% to $6,244. Asia-Europe moved in the opposite direction, with Shanghai to Genoa falling 8% to $5,080 and Shanghai to Rotterdam dropping 5% to $4,425. The report described a volatile East-West container market shaped by tighter capacity, blank sailings, carrier surcharge announcements, security concerns around Suez and Hormuz, Panama Canal restrictions, Asian port congestion after Typhoon Dolphin, and Rhine low-water pressure on inland transport.

Ship Universe Container Rate Watch

Operator Impact Snapshot

The composite index moved only 1%, but the route split underneath it was much sharper.

The latest WCI report shows a divided container market: U.S.-bound Transpacific rates are rising again while Asia-Europe spot rates are losing ground.

High

Transpacific rate pressure

Shanghai to New York jumped 10% and Shanghai to Los Angeles rose 6%, turning U.S.-bound cargo into the strongest pricing story in the report.

Medium

Composite index support

The WCI rose for a second consecutive week to $4,339 per 40ft container, suggesting the market has not returned to the late-July downtrend.

Watch

Asia-Europe rate pullback

Shanghai to Genoa fell 8% and Shanghai to Rotterdam fell 5%, showing weaker momentum despite constrained capacity on the lane.

High

Blank-sailing discipline

Carriers have been restricting space on the Transpacific, with 10 cancellations in each of the past two weeks and seven planned for the next week.

High

Surcharge stack risk

Panama Canal surcharges, security-related route uncertainty, inland water constraints, and congestion can raise the all-in cost beyond the base ocean rate.

Commercial Reading

The current WCI story is not a broad global rate boom. It is a lane-specific pricing rebound led by Transpacific capacity control and U.S.-bound demand.

  • BCOs: U.S. import budgets need a lane-by-lane review because East Coast and West Coast rates are now moving faster than the composite index.
  • Forwarders: rate volatility gives room for repricing, but customer pushback may rise if Europe lanes are weakening at the same time.
  • Carriers: blank sailings are supporting prices, but too much capacity discipline can increase rollover risk and service complaints.
  • Ports: congestion and weather disruption in Asia are now part of the rate-support story, not just an operations issue.
  • Shippers using Panama routings: surcharge announcements make all-in landed cost more important than the ocean base rate alone.
Operator note: The strongest signal is the spread between Transpacific gains and Asia-Europe declines. The composite WCI rose 1%, but Shanghai to New York moved 10% higher while Shanghai to Genoa dropped 8%.

WCI Rate Board

Transpacific Strength Against Asia-Europe Weakness

The latest WCI table shows rate power concentrating on U.S.-bound lanes while Europe lanes soften.

Latest WCI Numbers

Drewry WCI composite $4,339

Up 1% per 40ft container, marking the second consecutive weekly increase.

Shanghai to New York $8,706

Up 10%, the sharpest route move in the latest assessment.

Shanghai to Los Angeles $6,244

Up 6%, confirming renewed Transpacific pricing pressure.

Shanghai to Genoa $5,080

Down 8%, showing Mediterranean spot-rate weakness despite announced FAK increases.

Shanghai to Rotterdam $4,425

Down 5%, reflecting a softer North Europe lane.

Transpacific cancellations 10 / 10 / 7

Ten blank sailings in each of the past two weeks, with seven cancellations planned for next week.

Market signal: the composite index is masking a major split. U.S. lanes are climbing sharply, Europe lanes are dropping, and carriers are using capacity management plus surcharge announcements to defend pricing.

Rate and Cost Table

Lane or Driver Latest Figure Market Signal Commercial Effect Pressure Meter
Composite WCI Global benchmark $4,339 per 40ft, up 1%. Second weekly increase after a late-July decline period. The headline number shows support, but lane-level divergence matters more. Medium High
Shanghai to New York Asia to U.S. East Coast $8,706 per 40ft, up 10%. Strongest pricing lane in the report. East Coast importers face the highest rate pressure and Panama-linked surcharge exposure. High
Shanghai to Los Angeles Asia to U.S. West Coast $6,244 per 40ft, up 6%. West Coast rates also strengthened, but remain below East Coast pricing. West Coast routing can still be a cost-control option if inland rail and transload capacity are available. High
Shanghai to Genoa Asia to Mediterranean $5,080 per 40ft, down 8%. Mediterranean pricing weakened even as some carriers announced higher FAK rates. The gap between announced rates and demand strength will decide whether increases stick. Watch
Shanghai to Rotterdam Asia to North Europe $4,425 per 40ft, down 5%. North Europe lost momentum despite limited blank sailing announcements. Rate softness may be offset by inland delays if Rhine low-water disruption continues. Medium
Blank Sailings Capacity control 10 cancellations in each of the last two weeks, seven planned next week on Transpacific. Carriers are actively restricting space to support rates. Lower available capacity can raise rollover risk even when ships are still sailing. High
Panama Canal Surcharges Asia to U.S. East Coast and Gulf Carrier surcharge announcements are stacking onto base ocean freight. Canal cost and restriction risk are now part of the Transpacific all-in rate story. All-in freight files need to separate ocean rate, canal surcharge, fuel, congestion, and inland adders. High
Disruption Stack Suez, Hormuz, Asia ports, Rhine Drewry cited security, waterway, congestion, and inland-transport disruptions together. Multiple small constraints can combine into a larger reliability problem. The rate quote may be only one part of the landed-cost and lead-time picture. High

WCI Booking Pressure Calculator

Estimate ocean freight exposure, surcharge stack, delay cost, and booking pressure using the latest Drewry lane figures.

This tool converts the latest WCI lane rates into an all-in planning estimate for a shipment block.

Choose the closest lane or use the composite benchmark.
Use FEU count for the shipment, purchase order block, or weekly booking window.
Include fuel, security, peak, congestion, documentation, or carrier-specific adders.
Use only if the routing or carrier tariff applies a canal-related charge.
Use time lost from blank sailings, congestion, inland disruption, or rolled cargo.
Use storage, inventory carrying cost, customer penalty, warehouse disruption, or missed delivery value.
Use a positive value for another GRI or a negative value for expected correction.
Higher means the cargo is less flexible on arrival timing.
Higher means more risk from blank sailings, rollovers, or limited allocation.

Ocean Base Cost

$261,180

Selected WCI lane rate multiplied by 40ft container count.

Total Freight With Surcharges

$284,430

Ocean base cost plus selected surcharge and canal-cost assumptions.

Delay Exposure

$4,200

Estimated cargo delay cost if blank sailings, congestion, or inland disruption affect the move.

Next Move Exposure

$14,222

Estimated freight change if rates move by the selected percentage before booking.

Lane rate pressure87%
Surcharge pressure78%
Delay pressure44%
Capacity pressure78%
Booking pressure score76%

Booking Signal

Protect Space

The model shows elevated booking pressure. High lane rates, limited space, surcharges, and cargo urgency make waiting risky.

Use note: This calculator is a planning model, not freight, legal, procurement, customs, or financial advice. Actual cost depends on carrier, service string, equipment type, origin terminal, destination ramp, surcharges, contract terms, allocation, cargo readiness, customs timing, port congestion, and inland transport conditions.
Feedback Welcome

We welcome your feedback, suggestions, corrections, and ideas for enhancements.

Please click here to get in touch
By the ShipUniverse Editorial Team — About Us | Contact


← Browse more ShipUniverse posts
MARITIME DECISION TOOLS

Practical tools for real vessel and commercial decisions

Browse the latest 24 tools or instantly search every published ShipUniverse maritime tool.

24 latest toolsView all 282 →
TOOL

Marine Equipment OEM Warranty, Service SLA & Repair Claim Tool

🔔 Subscribe to ShipUniverse Weekly → Equipment Reliability · OEM Claims…

Open →
TOOL

Freight Forwarder Shipment Quotation, Buy/Sell Rates, Routing & Margin Tool

🔔 Subscribe to ShipUniverse Weekly → Freight forwarding · NVOCC pricing…

Open →
TOOL

Ro-Ro Vehicle Terminal Yard Capacity, PDI & Vessel Loading Flow Tool

🔔 Subscribe to ShipUniverse Weekly → Vehicle terminals · PCTC &…

Open →
TOOL

Marine Hull & P&I Renewal, Premium Quote, Deductible & Coverage Comparison Tool

🔔 Subscribe to ShipUniverse Weekly → Marine Insurance · Renewal Tender…

Open →
TOOL

Offshore Support Vessel Charter Bid, Utilization & Campaign Profitability Tool

🔔 Subscribe to ShipUniverse Weekly → Offshore commercial operations · PSV…

Open →
TOOL

Marine Repair Tender, Shipyard Bid Comparison & Contract Cost Risk Tool

🔔 Subscribe to ShipUniverse Weekly → Ship Repair Procurement · Yard…

Open →
TOOL

Container Transshipment, Missed Connection, Rollover & Recovery Cost Tool

🔔 Subscribe to ShipUniverse Weekly → Container Liner Networks · Feeder-to-Mother…

Open →
TOOL

Vessel Pre-Purchase Technical Survey, Defect Valuation & Acquisition CAPEX Tool

🔔 Subscribe to ShipUniverse Weekly → Vessel S&P · Technical Due…

Open →
TOOL

Contract of Affreightment, Cargo Nomination, Fleet Allocation & Fulfilment Risk Tool

🔔 Subscribe to ShipUniverse Weekly → Dry Bulk Contracts · Cargo…

Open →
TOOL

Port Pilotage, Tug Dispatch, Berth Window & Marine Services Coordination Tool

🔔 Subscribe to ShipUniverse Weekly → Harbor Operations · Pilotage ·…

Open →
TOOL

Offshore Heavy Lift, Crane Spread, Weather Window & Installation Cost Tool

🔔 Subscribe to ShipUniverse Weekly → Offshore Construction · Heavy Lifts…

Open →
TOOL

Cruise Embarkation, Terminal Security, Gangway Queue & Passenger Processing Tool

🔔 Subscribe to ShipUniverse Weekly → Cruise Operations · Terminal Security…

Open →
TOOL

Dangerous Goods Declaration, Booking Acceptance & Documentation Readiness Tool

🔔 Subscribe to ShipUniverse Weekly → IMDG Documentation · Dangerous Goods…

Open →
TOOL

Marine Salvage, Wreck Removal, Pollution Response & Casualty Cost Tool

🔔 Subscribe to ShipUniverse Weekly → Marine Casualty · Emergency Salvage…

Open →
TOOL

Ferry Route Capacity, Timetable Reliability & Passenger Revenue Tool

🔔 Subscribe to ShipUniverse Weekly → Ferry Networks · Route Planning…

Open →
TOOL

Inland Barge Tow, Lock Delay, Fleet Utilization & Voyage Profitability Tool

🔔 Subscribe to ShipUniverse Weekly → Inland Navigation • Towboat Economics…

Open →
TOOL

Marine Bunker Procurement, Supplier Quote Comparison & Delivered Fuel Cost Tool

🔔 Subscribe to ShipUniverse Weekly → Bunker Procurement • Fuel Grades…

Open →
TOOL

Reefer Cargo Temperature Excursion, Cold Chain & Cargo Claim Exposure Tool

🔔 Subscribe to ShipUniverse Weekly → Reefer Cargo • Temperature Evidence…

Open →
TOOL

Electronic Bill of Lading, Cargo Release & Documentation Discrepancy Tool

🔔 Subscribe to ShipUniverse Weekly → Container Shipping • Digital Trade…

Open →
TOOL

Crew Change, Relief Logistics, Port Coordination & Cost Tool

🔔 Subscribe to ShipUniverse Weekly → Fleet Crewing • Seafarer Repatriation…

Open →
TOOL

Marine Insurance Hull, P&I, Deductible & Claim Reserve Tool

🔔 Subscribe to ShipUniverse Weekly → Marine Claims • Hull &…

Open →
TOOL

Shipbuilding Milestone, Change Order, Yard Delay & Payment Exposure Tool

🔔 Subscribe to ShipUniverse Weekly → Newbuilding Contract Control • Yard…

Open →
TOOL

Project Cargo Sea Fastening, Deck Load & Transport Planning Tool

🔔 Subscribe to ShipUniverse Weekly → Project Cargo • Deck Strength…

Open →
TOOL

Maritime Emissions Data Verification, MRV & FuelEU Audit Readiness Tool

🔔 Subscribe to ShipUniverse Weekly → Emissions Assurance • Fuel Traceability…

Open →