
🔔 Subscribe to ShipUniverse Weekly →
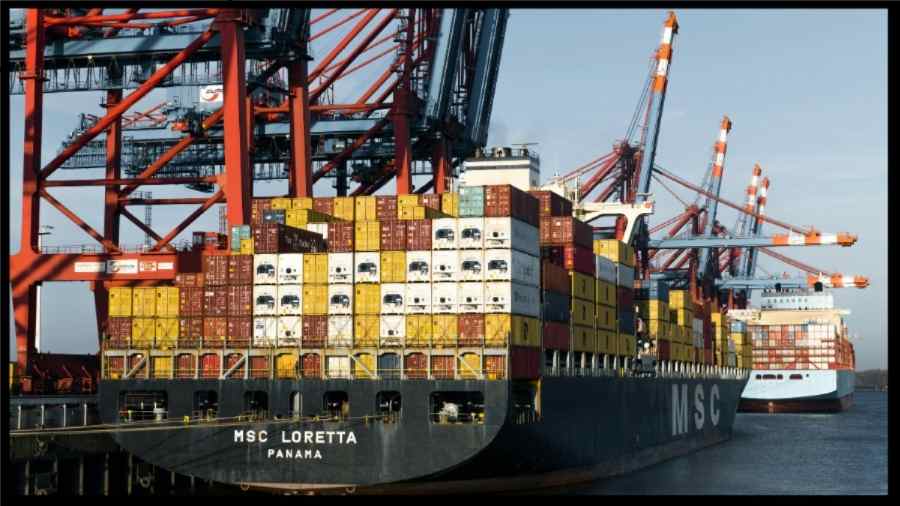
Mediterranean Shipping Company has pushed its grip on the liner market to a level the sector has never seen before. Fresh Alphaliner-based reporting says MSC reached 21.5% of total global container capacity in May, then extended that to about 21.6% as of June 9, with an operated fleet of roughly 7.329m teu. That puts MSC comfortably beyond the previous single-carrier benchmark set by Maersk in 2018 and cements the Swiss carrier’s transformation from a strong number-two line into the industry’s dominant standalone operator. The latest figures come only weeks after MSC also became the first liner operator to reach 1,000 ships, underscoring that this is not a one-week statistical spike but the result of a multi-year expansion drive built on secondhand buying, aggressive newbuilding intake, and post-alliance network scale.
MSC’s scale does not automatically move freight rates overnight, but it does increase its ability to shape capacity deployment across major east-west trades.
Direct insurance effects are limited, though concentration at the top can matter indirectly through counterparty size, terminal exposure, and network centrality.
There is no immediate bunker shock here. The story is mainly about scale, network control, and the ability to absorb cost swings across a very large fleet.
A carrier of this size has more influence over loop design, transshipment flows, terminal utilization, and schedule concentration across global port systems.
The biggest effect is on chartering leverage, fleet strategy, and competitive pressure, especially for rivals trying to match MSC’s vessel access and standalone network scale.
| Fast reader take | Latest confirmed signal | Operational meaning | Commercial consequence | Shows up first | Closest stakeholders |
|---|---|---|---|---|---|
| MSC has set a new ceiling for single-carrier market share |
Alphaliner-based reporting says MSC reached 21.5% of global liner capacity in May and around 21.6% by June 9.
21.5% in May
21.6% by June 9
all-time high
|
No carrier has held this much share of the world liner fleet before in TEU terms. | Rivals are now competing against a line with unprecedented deployment flexibility and wider network control. | More strategic pressure on competitors and alliance structures. | Carriers, charterers, shippers, terminal operators. |
| The old record is no longer close |
The previous benchmark was Maersk’s 19.3% share in 2018.
Maersk 19.3%
2018 benchmark
MSC now above it
|
MSC did not just edge past the old high. It moved more than two percentage points beyond it. | The industry is now dealing with a different concentration scale than the one it used for the last decade. | More scrutiny of competitive balance and service strategy. | Regulators, rival carriers, cargo owners. |
| The fleet size behind the share is massive |
Latest reporting puts MSC’s operated fleet at about 7.329m teu.
7.329m teu
global leader
fleet scale
|
The company now has enough scale to support a very broad standalone network without depending on an alliance for basic coverage. | That creates more room to optimize loops, route choices, and commercial positioning independently. | Network redesign and service differentiation. | Operators, shippers, port planners, brokers. |
| The growth was built, bought, and delivered |
MSC has combined a huge secondhand acquisition drive with sustained newbuilding deliveries, including 54 new ships in 2025.
54 deliveries in 2025
secondhand spree
831,400 teu added
|
This was not a passive rise caused by rivals shrinking. It came from deliberate capacity accumulation over several years. | Competitors face a leader that expanded through both asset ownership and newbuild pipeline depth. | Stronger pressure on charter markets and fleet replacement planning. | Shipowners, lessors, shipyards, competing lines. |
| The post-2M strategy is now visible in hard numbers |
MSC built for life after the 2M alliance and launched a standalone east-west network with 34 loops across five trades.
post-2M buildout
34 loops
five trades
|
The fleet expansion was closely tied to the decision to operate at larger scale outside a major alliance structure. | MSC can now present shippers with coverage built on owned and controlled scale rather than alliance dependency. | Commercial repositioning on key east-west routes. | Shippers, alliance partners, competitors. |
| The concentration story extends beyond MSC alone |
Reporting says the ten largest carriers held about 84.7% of global capacity at end-May, just under the all-time high of 84.8%.
Top 10 at 84.7%
near record concentration
market consolidation
|
MSC’s rise is happening inside an already highly concentrated liner market. | The record is as much about system-wide concentration as it is about one carrier’s expansion. | Fewer players controlling more global capacity. | Regulators, cargo interests, smaller carriers, ports. |
The most important change is not that MSC is number one. It has been number one for years. The real shift is that it now occupies a share band no carrier previously reached, while doing so with a fleet large enough to support an alliance-light operating model across the main east-west trades.
Liner Concentration Pressure Tool
This built-in tool estimates whether MSC’s latest milestone is simply a record number or a stronger concentration shift that changes how the liner market behaves. It combines market share dominance, fleet scale, independent network strength, and top-10 concentration into one live score.
Live concentration inputs
Adjust the sliders to test whether MSC’s latest record mostly changes perception or whether it materially shifts competitive pressure in liner shipping.
Live readout
This section turns MSC’s latest record into one score showing whether the market is seeing a headline milestone or a deeper structural concentration shift.
MSC’s latest milestone looks like a structural leadership gap because record share, exceptional fleet scale, and stronger standalone network control are now reinforcing one another.
The record is notable, but it does not materially change the competitive structure of liner shipping.
MSC is plainly ahead, though rivals still operate close enough to keep the gap strategically manageable.
The company’s size and independence now create a competitive distance that is meaningfully harder for peers to replicate.
The market has moved into a new concentration era in which one carrier’s scale materially redefines sector balance.
The key question is not whether MSC is larger than everyone else. It is whether its lead has become large enough to change how ships are ordered, charters are fixed, alliances are designed, and networks are built. The latest numbers suggest that answer is moving closer to yes.
We welcome your feedback, suggestions, corrections, and ideas for enhancements. Please click here to get in touch.