
SHIPUNIVERSE
Maritime Intelligence, Tools & Live Industry Radars

One place for live maritime intelligence, practical decision tools, industry events and focused reporting.

17Live Radars 286Maritime Tools
24/7Intelligence Focus
GlobalIndustry Coverage
RADARS
TOOLS
All Tools
Latest 20
Open to load latest items…
NEWS
All News
Latest 20
Open to load latest items…
REPORTS
All Reports
Latest 20
Open to load latest items…
TECH
All Tech
Latest 20
Open to load latest items…
CRUISE
All Cruise
Latest 20
Open to load latest items…
NAVAL
All Naval
Latest 20
Open to load latest items…
SHIPUNIVERSE REPORTING

Reports, news and industry coverage

Full analysis in the ShipUniverse intelligence layout.

← Back to latest posts ShipUniverse / NEWS

Freight Markets Cool as Tankers Heat Up

🔔 Subscribe to ShipUniverse Weekly →

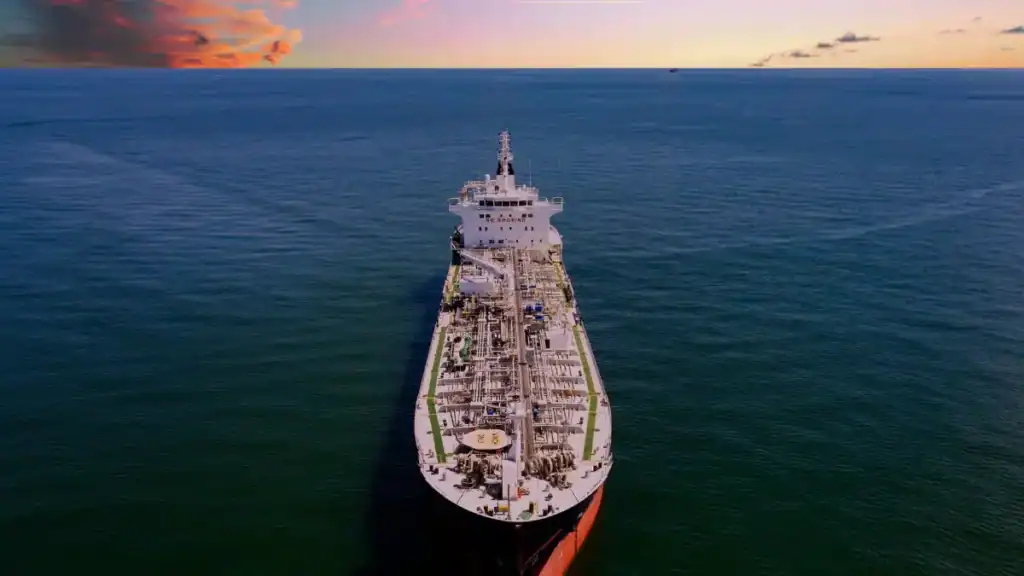
Global shipping trends are taking distinct turns this week across container, tanker, and LNG freight sectors. Container rates are pulling back from recent highs as risk-fuelled demand begins to stabilize. Meanwhile, energy freight routes, especially tankers and LNG carriers in key geopolitical zones, remain elevated. Here’s an in-depth look at each segment and the forces shaping them.

We welcome your feedback, suggestions, corrections, and ideas for enhancements. Please note that rates and market conditions constantly fluctuate — always verify figures with current sources when making operational or financial decisions. Please click here to get in touch.

(view news summary)


Container Freight Rates Pull Back

Shanghai to U.S. West Coast container freight rates dropped dramatically over recent days:

  • Price pullback
    Rates fell from approximately US $6,000 to US $2,500 per 40-foot container by June 26. This represents one of the steepest week-over-week declines in recent years, indicating a strong demand correction.
  • WCI pressure
    Drewry’s World Container Index declined by 9% for a second consecutive week, now settled at US $2,983. This suggests sustained downstream weakness rather than a temporary dip.
  • Underlying drivers
    The initial surge in container demand earlier in June was driven by U.S. restocking after tariff relief. With inventory needs met, demand has returned to traditional levels.
  • Carrier strategies
    In response, shipping lines are implementing blank sailings and reallocating vessels to deal with lower load factors, aiming to prevent deep rate erosion.
Weekly Freight Rate Movements by Corridor
Trade Lane June 1 Rate (USD/FEU) June 26 Rate (USD/FEU) % Change Status
Shanghai → Los Angeles 4,100 2,500 -39.0% Falling
Shanghai → New York 6,550 5,703 -12.9% Falling
Shanghai → Rotterdam 3,170 3,204 +1.1% Stable
Shanghai → Genoa 3,890 4,100 +5.4% Rising
Singapore → Dubai 1,420 1,510 +6.3% Rising
Houston → Rotterdam 2,100 2,150 +2.4% Stable
Note: Rates reflect standard 40-foot container pricing (USD/FEU) from Drewry and regional data aggregators. Data is as of June 27, 2025 and may vary by contract terms and port-specific fees.

Tanker Rates See Sharp Spike

Tanker routes, particularly those moving crude from the Gulf, experienced a sudden surge:

  • VLCC charter boom
    Charter rates from the Persian Gulf to Asia climbed over 40%, peaking at more than US $60,000 per day. This spike reflects sharply reduced vessel availability amid heightened regional risk.
  • War-risk spikes
    Incidents near the Strait of Hormuz led to elevated war-risk insurance premiums. Although some premiums eased post-ceasefire, elevated coverage fees remain a cost factor for operators.
  • Operational disruption
    To avoid danger zones, many tankers executed U-turns or paused, reducing transit volumes through the Hormuz corridor by roughly one-third. Delays are rippling across global crude logistics.
  • Potential for prolonged volatility
    Should regional tensions flare again, tanker rates could surge further. Conversely, sustained peace may lead to normalization—but not without lingering elevated insurance and operational overheads.

LNG Carrier Rates at Eight‑Month Peak

LNG routes are also experiencing sustained rate increases:

  • Spot highs reached
    Atlantic spot rates for LNG tankers recently rose to US $51,750 per day, while Pacific rates hit US $36,750 per day—levels not seen since late 2024.
  • Vessel repositioning
    Ships have been withdrawn from charting routes near the Middle East, tightening the global LNG vessel pool and raising competition for remaining charters.
  • Demand-side pressure
    Heightened Asian demand prior to peak summer needs and better price spreads for forward cargoes are adding upward pressure on LNG freight pricing.
  • Market light in glimmer
    While high rates strain importers, they also boost earnings for vessel operators—though overexposure to volatile freight could raise risk in short-term markets.
Tanker and LNG Freight Rate Snapshot
Route / Segment Freight Type Spot Rate (USD/day) Change vs Early June Trend
VLCC Gulf → Japan Crude Tanker $62,500 +43% Rising
Suezmax Med → Asia Crude Tanker $45,300 +18% Stable
Strait of Hormuz Transits Crude Tanker (avg) $61,000 +35% Elevated
Middle East → Japan LNG Carrier $116,000 +14% Rising
U.S. Gulf → Europe LNG Carrier $92,000 +5% Stable
Note: Spot rates reflect late June 2025 benchmarks. Data compiled from Drewry, Clarksons, and industry tracking as reported in the past 5 days. Trends may vary by vessel age, ballast leg cost, and insurance premium fluctuations.

Divergence Across Container Corridors

Shipping regions are diverging in rate trends, with Asia–Europe lanes remaining steadier than transpacific routes:

  • Asia → North America
    • Shanghai → New York dropped 13% to US $5,703.
    • Shanghai → Los Angeles fell 20% but continues trading far above early May levels.
  • Asia → Europe
    Rates remain stable or slightly positive:
    • Shanghai → Rotterdam: around US $3,204
    • Shanghai → Genoa: close to US $4,100
  • Impact analysis
    The larger drop on transpacific routes suggests U.S. retail demand is cooling faster than European consumption. Europe markets appear more insulated due to regional restocking and less aggressive tariff-driven demand shifts.
  • Strategic response
    Carriers may reallocate vessel capacity from softening transpacific routes to stronger Europe lanes, maintaining load efficiency.

U.S. West Coast Port Volumes Slip

Container terminal activity also reflects broader demand changes on the ground:

  • Import volume dip
    Major ports like Los Angeles and Long Beach recorded a 9% drop in May imports, signifying weaker consumer purchasing and economic rebalancing.
  • Scheduling impacts
    Reduced volume translates to fewer port calls, idle quay crews, and potentially more blanked vessel rotations or diverted liner deployments.
  • Ripple effects
    A sustained slowdown could pressure truckers, rail yards, and warehouse operators connected to container throughput, increasing drag on broader supply chains.
Strategic Carrier Adjustments Across Markets
Region or Trade Lane Carrier Adjustment Reason Behind Action Impact on Market
Transpacific (Asia → U.S.) Increased blank sailings by ~20% Container spot rates dropped ~39% (e.g. Shanghai–LA down to US$2,500) as U.S. demand cooled Aims to stabilize rates; capacity became constrained late June
Asia → Europe (Rotterdam/Genoa) Maintained schedules with minor port reallocations Rates held steady or rose (~US$3,200–4,100) amid balanced demand Services remain reliable; spot rates slightly positive
Middle East → Asia (Tankers & LNG) Diverted vessels; pauses/anchor delays near Hormuz Security concerns following Iran–Israel escalation, GPS jamming, and regional delays :contentReference[oaicite:1]{index=1} Spot freight surged (+40%+), operational costs and insurance premiums remain elevated
Global carriers (Alliances) Routed more via transshipment hubs (Colombo, Salalah) Responding to route disruptions and port congestion :contentReference[oaicite:2]{index=2} Provides flexibility, though transit times and ETA reliability vary
Note: Adjustments reflect real-time carrier behavior in late June, based on schedule data, port notices, and shipping analytics.

As global freight markets recalibrate, the split between container and energy shipping segments has grown more pronounced. Container rates are normalizing after months of sharp climbs, signaling that the U.S. restocking wave and tariff-driven surges may have peaked. At the same time, tanker and LNG routes remain reactive to regional unrest, with rate volatility now tied more closely to political signals than economic fundamentals.

Heading into the third quarter of 2025, carriers are expected to rely on blank sailings, route optimization, and contract filtering to maintain profitability in uncertain waters. Meanwhile, shippers and terminal operators face a complex environment that requires strategic forecasting, flexible logistics planning, and diversified routing decisions.

These conditions suggest a maritime economy in transition. For now, resilience and responsiveness, not reliance on past trends, will define success across the shipping landscape.

News Summary
Category Key Updates Recent Trend Market Impact Outlook
China–U.S. Container Rates Rates fell from ~$6,000 to ~$2,500 (Shanghai–LA) Down ~39% Weaker demand, normalization post-tariff rebound Further softening expected if U.S. demand cools
Asia–Europe Rates Shanghai–Rotterdam +1.1%; Genoa +5.4% Mostly stable Healthy demand keeping corridor balanced Likely to hold stable unless shocks emerge
Tanker Rates (Gulf–Asia) VLCC rates surged 40%+ amid tensions Elevated Conflict zone avoidance, higher insurance Geopolitical sensitivity remains high
LNG Freight 8-month highs as Middle East to Asia tightens Rising Charter scarcity, route shifts Likely elevated if energy tensions persist
Carrier Tactics Blank sailings, transshipment hubs used Dynamic Controls rate collapse, adds transit complexity More agile routing expected through Q3
Port Activity U.S. imports down 9% (e.g. LA/LB) Weak Slack demand, shift to alternate ports Volume weakness may persist into summer
Note: Data reflects verified shipping activity and rate movements reported. Trends subject to real-time geopolitical and economic changes.

By the ShipUniverse Editorial Team — About Us | Contact


← Browse more ShipUniverse posts
MARITIME DECISION TOOLS

Practical tools for real vessel and commercial decisions

Browse the latest 24 tools or instantly search every published ShipUniverse maritime tool.

24 latest toolsView all 286 →
TOOL

Port Waste Reception, MARPOL Delivery Notice, Disposal Logistics & Charge Verification Tool

🔔 Subscribe to ShipUniverse Weekly → Port Operations · MARPOL Waste…

Open →
TOOL

Maritime Crew Recruitment, Retention, Manning Agency Fees & Attrition Cost Tool

🔔 Subscribe to ShipUniverse Weekly → ShipUniverse · Fleet Crewing Economics…

Open →
TOOL

Container Rail Intermodal Connection, Terminal Dwell & Train Slot Tool

🔔 Subscribe to ShipUniverse Weekly → Ship-to-Rail · Intermodal Terminal ·…

Open →
TOOL

Bulk Grain Cargo Quality, Fumigation, Hold Readiness & Rejection Exposure Tool

🔔 Subscribe to ShipUniverse Weekly → Cargo quality · Hold inspection…

Open →
TOOL

Marine Equipment OEM Warranty, Service SLA & Repair Claim Tool

🔔 Subscribe to ShipUniverse Weekly → Equipment Reliability · OEM Claims…

Open →
TOOL

Freight Forwarder Shipment Quotation, Buy/Sell Rates, Routing & Margin Tool

🔔 Subscribe to ShipUniverse Weekly → Freight forwarding · NVOCC pricing…

Open →
TOOL

Ro-Ro Vehicle Terminal Yard Capacity, PDI & Vessel Loading Flow Tool

🔔 Subscribe to ShipUniverse Weekly → Vehicle terminals · PCTC &…

Open →
TOOL

Marine Hull & P&I Renewal, Premium Quote, Deductible & Coverage Comparison Tool

🔔 Subscribe to ShipUniverse Weekly → Marine Insurance · Renewal Tender…

Open →
TOOL

Offshore Support Vessel Charter Bid, Utilization & Campaign Profitability Tool

🔔 Subscribe to ShipUniverse Weekly → Offshore commercial operations · PSV…

Open →
TOOL

Marine Repair Tender, Shipyard Bid Comparison & Contract Cost Risk Tool

🔔 Subscribe to ShipUniverse Weekly → Ship Repair Procurement · Yard…

Open →
TOOL

Container Transshipment, Missed Connection, Rollover & Recovery Cost Tool

🔔 Subscribe to ShipUniverse Weekly → Container Liner Networks · Feeder-to-Mother…

Open →
TOOL

Vessel Pre-Purchase Technical Survey, Defect Valuation & Acquisition CAPEX Tool

🔔 Subscribe to ShipUniverse Weekly → Vessel S&P · Technical Due…

Open →
TOOL

Contract of Affreightment, Cargo Nomination, Fleet Allocation & Fulfilment Risk Tool

🔔 Subscribe to ShipUniverse Weekly → Dry Bulk Contracts · Cargo…

Open →
TOOL

Port Pilotage, Tug Dispatch, Berth Window & Marine Services Coordination Tool

🔔 Subscribe to ShipUniverse Weekly → Harbor Operations · Pilotage ·…

Open →
TOOL

Offshore Heavy Lift, Crane Spread, Weather Window & Installation Cost Tool

🔔 Subscribe to ShipUniverse Weekly → Offshore Construction · Heavy Lifts…

Open →
TOOL

Cruise Embarkation, Terminal Security, Gangway Queue & Passenger Processing Tool

🔔 Subscribe to ShipUniverse Weekly → Cruise Operations · Terminal Security…

Open →
TOOL

Dangerous Goods Declaration, Booking Acceptance & Documentation Readiness Tool

🔔 Subscribe to ShipUniverse Weekly → IMDG Documentation · Dangerous Goods…

Open →
TOOL

Marine Salvage, Wreck Removal, Pollution Response & Casualty Cost Tool

🔔 Subscribe to ShipUniverse Weekly → Marine Casualty · Emergency Salvage…

Open →
TOOL

Ferry Route Capacity, Timetable Reliability & Passenger Revenue Tool

🔔 Subscribe to ShipUniverse Weekly → Ferry Networks · Route Planning…

Open →
TOOL

Inland Barge Tow, Lock Delay, Fleet Utilization & Voyage Profitability Tool

🔔 Subscribe to ShipUniverse Weekly → Inland Navigation • Towboat Economics…

Open →
TOOL

Marine Bunker Procurement, Supplier Quote Comparison & Delivered Fuel Cost Tool

🔔 Subscribe to ShipUniverse Weekly → Bunker Procurement • Fuel Grades…

Open →
TOOL

Reefer Cargo Temperature Excursion, Cold Chain & Cargo Claim Exposure Tool

🔔 Subscribe to ShipUniverse Weekly → Reefer Cargo • Temperature Evidence…

Open →
TOOL

Electronic Bill of Lading, Cargo Release & Documentation Discrepancy Tool

🔔 Subscribe to ShipUniverse Weekly → Container Shipping • Digital Trade…

Open →
TOOL

Crew Change, Relief Logistics, Port Coordination & Cost Tool

🔔 Subscribe to ShipUniverse Weekly → Fleet Crewing • Seafarer Repatriation…

Open →