
SHIPUNIVERSE
Maritime Intelligence, Tools & Live Industry Radars

One place for live maritime intelligence, practical decision tools, industry events and focused reporting.

17Live Radars 300Maritime Tools
24/7Intelligence Focus
GlobalIndustry Coverage
RADARS
TOOLS
All Tools
Latest 20
Open to load latest items…
NEWS
All News
Latest 20
Open to load latest items…
REPORTS
All Reports
Latest 20
Open to load latest items…
TECH
All Tech
Latest 20
Open to load latest items…
CRUISE
All Cruise
Latest 20
Open to load latest items…
NAVAL
All Naval
Latest 20
Open to load latest items…
SHIPUNIVERSE REPORTING

Reports, news and industry coverage

Full analysis in the ShipUniverse intelligence layout.

← Back to latest posts ShipUniverse / NEWS

BYD Is Putting Its Batteries on a 9,100-Car Ammonia Ship: 8 Technologies That Could Rewrite Deep-Sea Fuel Costs

🔔 Subscribe to ShipUniverse Weekly →

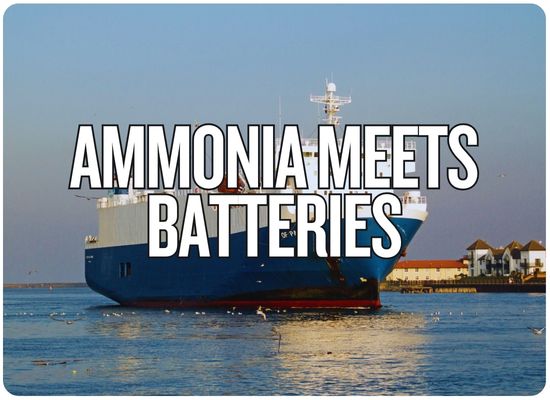
Höegh Autoliners and Chinese battery manufacturer BYD announced a technology partnership on November 9, 2026, to install a containerized marine battery system aboard Aurora No. 12, a 9,100-car-capacity vessel scheduled for delivery in May 2028. The agreement, announced during COP31 in Antalya, Türkiye, will combine BYD battery storage with solar panels, a shaft generator and an ammonia-capable propulsion system. Höegh estimates that the integrated technologies could reduce greenhouse gas emissions by approximately 1,000 metric tonnes of CO₂-equivalent annually while lowering fuel consumption. The vessel is being built at China Merchants Heavy Industry's Jiangsu shipyard and will be designed to operate on ammonia from delivery. Financial terms, battery capacity and detailed operating-performance figures have not been disclosed.

ShipUniverse | Deep-Sea Energy Technology

Eight Technologies.
One Connected Energy System.

BYD's new marine battery installation joins ammonia-capable propulsion and the Aurora Class's established energy-efficiency features. The value will come from how the systems work together, not simply how many technologies are installed.

9,100CEU carrying capacityNominal capacity for an Aurora Class car carrier
~1,000tAnnual CO₂e reductionProjected integrated-system improvement, not verified results
1,500m²Solar array designPublished Aurora Class design specification
How the shipboard energy system connects
Ammonia-capable enginePrimary propulsion energy; availability and fuel type determine actual emissions and costs
Shaft generator + solarElectricity from engine shaft and sunlight under different operating conditions
BYD battery storageStores electrical energy, supplies peak loads and supports more efficient power management
↓
Coordinated ship power | propulsion, auxiliary loads, port operations and fewer inefficient generator-running hours
Functional concept only. A battery stores energy; it does not produce fuel or create net energy. A shaft generator uses power supplied by the main engine. The final electrical architecture and battery rating have not been publicly specified.
Eight technologies and operating features / Expand for details
1BYD containerized marine batteriesNew partnership | Planned+

Marine battery storage can supply short-duration electrical loads and smooth power peaks that would otherwise require extra auxiliary-generation capacity or inefficient engine operation.

Commercial test: Actual fuel saved per charge-discharge cycle, cycling life, cooling requirements and installed capital cost. No system kWh rating or battery chemistry has been disclosed for Aurora No. 12.
2Solar photovoltaic generationExisting Aurora Class design+

The class design includes approximately 1,500 m² of solar panels. They can offset some onboard electrical consumption during suitable sunlight, but their output is small relative to deep-sea propulsion demand.

Commercial test: Annual delivered MWh after shading, weather, conversion losses and maintenance. Installed area is not the same as guaranteed energy production.
3Shaft-generator electrical powerNew integrated system | Planned+

A shaft generator converts engine-supplied mechanical energy into electricity. It can displace auxiliary-generator operation when electricity can be generated more efficiently through the main propulsion machinery.

Commercial test: Difference in specific fuel consumption between the shaft-powered and displaced auxiliary generation, after conversion losses.
4Ammonia-capable dual-fuel propulsionNo. 12 | Delivery specification+

Höegh plans to deliver Aurora No. 12 able to use ammonia. Ammonia contains no carbon, but engine operation may require pilot fuel and emissions controls, and the lifecycle footprint depends on ammonia production.

Commercial test: Ammonia price per unit of usable energy, bunkering availability, pilot fuel, NOx/N₂O controls and demonstrated engine reliability.
5Integrated energy managementEngineering requirement | Inferred role+

Coordinating the battery, solar array, shaft generator and electrical loads requires controls that decide when to charge, discharge or run generating equipment. The final software vendor and algorithm have not been named.

Commercial test: Fuel consumption over complete voyages, battery cycling and avoided auxiliary-engine running hours.
6Shore-power compatibilityExisting Aurora Class design+

Shore-power provisions allow a compatible vessel to receive electricity in port instead of generating all its hotel and auxiliary loads onboard.

Commercial test: Compatible port calls, delivered electricity price, connection time, grid emissions and actual installed interfaces.
7Alternative-fuel storage and safety systemsExisting class architecture | No. 12 details pending+

The Aurora Class incorporates fuel-readiness design, with an approximately 3,400 m³ LNG/ammonia-compatible tank documented on the first Aurora. Ammonia service requires compatible materials, containment, detection and crew procedures.

Commercial test: Certified tank and fuel-system specification for No. 12, cargo-space impact and the full cost of ammonia safety systems.
8High-capacity cargo and deck designExisting Aurora Class architecture+

The 9,100-CEU layout, reinforced decks and flexible ramps permit a broad vehicle and machinery mix. Higher effective cargo utilization can lower vessel emissions and operating costs per transported unit.

Commercial test: Actual CEU carried per sailing, deadweight utilization and route length, not nominal vehicle capacity alone.
Two emissions claims that must stay separate: Höegh's up-to-58% reduction in carbon emissions per transported car is an Aurora Class comparison against conventional PCTCs. The approximately 1,000 tonnes of annual CO₂e reduction is the newly reported estimate for the integrated technology arrangement. They have different baselines and cannot be added together.
Research basis: November 9 Höegh-BYD announcement as reported by gCaptain and ship.energy, Höegh Autoliners' Aurora Class technical pages and 2025 annual report, and IMO/DNV engineering guidance. Confirmed features are distinguished from proposed installations, performance projections and engineering inferences.
ShipUniverse | Technology-to-Economics Matrix

The Technology Is Real.
The Savings Still Need Proof.

Some improvements avoid auxiliary-engine fuel use, others change energy sourcing, and still others support larger cargoes or future fuel flexibility. The economic value of each must be evaluated separately.

~18.6Ammonia MJ/kgApproximate lower heating value, before engine-efficiency differences
~40Fuel oil MJ/kgIllustrative conventional marine fuel energy content
~3×Fuel volume pressureDNV notes roughly triple tank volume relative to marine gasoil for similar energy
Where eight technologies create or consume value
Scroll horizontally using either synchronized scrollbar. Benefits are engineering possibilities, not certified Aurora No. 12 savings.
SystemEconomic driverPrimary costs and limitationsWhat to measure after deliveryTransfer to other vessel classesEvidence status
01 / BYD marine batteryGenerator optimization, short power peaks and lower engine hoursInstalled CAPEX, battery replacement, cooling, fire protection and conversion lossesActual kWh cycled; fuel avoided; lifetime cycles; net efficiency benefitTankers, container ships, ferries, offshore ships and cruise vesselsAgreement announcedNo disclosed kWh, price or measured savings yet
02 / Solar panelsOffset part of auxiliary electric load when sunlight is availableInstallation area, shading, wiring, degradation and cleaningMetered annual MWh and actual fuel displacedLarge exposed-deck vessels, including some RoRo and bulk designsClass design1,500m² listed for Aurora Class, not verified delivered output
03 / Shaft generatorPotentially more efficient electricity from main machineryPower conversion, mechanical integration and main-engine efficiency at variable loadFuel intensity per delivered electrical MWh versus auxiliary generationMost ships with suitable mechanical propulsion arrangementsPartnership systemPlanned integration announced for No. 12
04 / Ammonia engineSubstitute fossil fuel; potential lifecycle carbon reduction with certified low-emission supplyFuel price, tank volume, pilot fuel, bunkering and toxicity controlsActual ammonia mass per voyage, well-to-wake GHG and safety performanceBulk carriers, tankers, container ships and larger specialist vesselsPlanned capabilityAbility from delivery stated; actual green-fuel consumption not yet shown
05 / Energy controlsCoordinate solar, battery, auxiliary demand and engine operationIntegration, cybersecurity, sensors, software and operator trainingOptimization gain against a consistent baseline voyage and load profileBroad applicability wherever multiple energy sources are usedEngineering inferenceSpecific control supplier and algorithms undisclosed
06 / Shore-power interfaceReplace at-berth generation when compatible electricity is availablePort fees, electrical connection, compatibility and grid-emissions intensityShore MWh used, avoided auxiliary-fuel cost, electricity cost and port availabilityCruise, container, RoRo and other ships with regular equipped port callsClass designShore-power readiness identified in Aurora program
07 / Fuel containmentEnable ammonia/LNG flexibility and future fuel-supply choicesTank volume, reduced available space, materials, inspection and gas safetyFuel flexibility actually used and cost per tonne of cargo transportedVessel types with sufficient space and suitable fuel-system designClass architecture3,400m³ tank publicly documented on first Aurora; No. 12 detail pending
08 / High-capacity cargo designLower cost and emissions per unit through higher effective loadingShip size, port constraints, demand, vehicle mix and voyage utilizationActual loaded CEU, cost/CEU and GHG/CEU over comparable routesOther cargo segments through class-specific design and loading improvementsExisting design9,100 nominal CEU per Aurora vessel
CONTINUED TABLE / HORIZONTAL SCROLL
The two biggest economic distinctions
Battery + solar + shaft-generator
Less fuel needed

These systems aim to reduce the energy required from fuel-burning generators and improve the timing of electrical production. Battery charging energy must still come from somewhere.

Ammonia propulsion
Different fuel cost

Ammonia replaces energy from conventional bunker fuel but generally requires more tonnes and storage volume for the same usable energy. The cost result depends on fuel pricing and conversion efficiency.

Three measurements investors and engineers need
01 / FUEL
Annual net tonnes saved

Measure actual energy use before and after the installation over comparable operating conditions, avoiding double counting.

02 / FINANCE
Installed cost and lifecycle

Include maintenance, safety systems, system replacement, financing and any effect on cargo capacity.

03 / EMISSIONS
Verified well-to-wake GHG

Count fuel production, pilot fuel, electricity sources and nitrous oxide, not only CO₂ emitted aboard ship.

Sources: Höegh Aurora Class technical reporting, DNV guidance on ammonia, IMO shaft-generator guidance. Ammonia and fuel-oil calorific values are approximate reference figures. The published 58% emissions-per-car claim and the new 1,000-tonne annual CO₂e estimate are not comparable percentages or additive savings.
ShipUniverse Interactive Tool | Deep-Sea Fuel & CAPEX ROI

Can Batteries, Solar and Ammonia Lower the Annual Fuel Bill?

Calculate separate energy-efficiency savings and ammonia fuel-switching costs. Test fuel prices, battery optimization, solar area, shaft generation, shore power, carbon value and the discounted return from a hypothetical technology investment.

01 / Conventional-fuel baseline
Illustrative annual fuel use
02 / Battery, solar and shaft power
Assumed net reduction in baseline fuel use
Published class design area
Equivalent full-output hours
Net efficiency differential, not full auxiliary consumption
03 / Ammonia substitution
0% by default: actual use is unconfirmed
Simplified usable-energy conversion assumption
04 / Investment and financial assumptions
Scenario benefit, not guaranteed credit
How the model works: Solar output assumes 0.20 kW rated panel power per m², 80% performance ratio and 365 days. Battery optimization, solar, shaft efficiency and shore-power benefits are treated as non-overlapping incremental fuel savings. Actual integrated systems may have substantial overlaps. Ammonia substitution applies to the remaining fuel-equivalent energy and excludes pilot-fuel and upstream lifecycle effects.
05 / Annual fuel economics
Annual operating fuel and electricity savings
$211k

Change in conventional versus modeled fuel and shore-power electricity expenditure, before annual maintenance or hypothetical carbon benefits.

331 tAnnual fossil-fuel-equivalent efficiency savings before ammonia substitution
263 MWhModeled annual solar electricity
0 tModeled annual ammonia consumption
1,030 tIllustrative direct fossil-combustion CO₂ reduction, not CO₂e
15.0 yearsSimple payback including hypothetical carbon value, when positive
$311/tAmmonia fuel-cost parity versus conventional fuel, before carbon value

Annual Energy Cost Bridge

Conventional fuel baseline$7.70m
Modeled fossil bunker after changes$7.47m
Modeled ammonia fuel purchase$0
Shore electricity purchase$21k
Modeled energy cost total$7.49m
Annual net benefit, including hypothetical carbon value
$234k

Energy savings, minus maintenance, plus monetized avoided direct combustion CO₂ under the user-selected assumption.

Cumulative Discounted Cash Flow

The graph begins with the entered upfront technology cost, then adds each year's modeled net benefit discounted at the selected rate. The graph and NPV recalculate whenever any input changes.

Calculating...
10-year NPV: calculating Zero line separates positive and negative investment value

What if ammonia use increases?

These cases preserve all entered efficiency assumptions while changing only the proportion of remaining fuel-equivalent energy supplied by ammonia. This compares annual purchased-energy costs, not verified lifecycle emissions.

0% ammonia$7.49mAnnual fuel + shore electricity cost
25% ammonia$8.60mAnnual fuel + shore electricity cost
50% ammonia$9.71mAnnual fuel + shore electricity cost
Feedback Welcome

We welcome your feedback, suggestions, corrections, and ideas for enhancements.

Please click here to get in touch
By the ShipUniverse Editorial Team — About Us | Contact


← Browse more ShipUniverse posts
MARITIME DECISION TOOLS

Practical tools for real vessel and commercial decisions

Browse the latest 24 tools or instantly search every published ShipUniverse maritime tool.

24 latest toolsView all 300 →
TOOL

Port Terminal Concession Bid, Throughput Guarantees, Tariff Escalation & Investment NPV Tool

🔔 Subscribe to ShipUniverse Weekly → SHIPUNIVERSE / PORT INFRASTRUCTURE INVESTMENT…

Open →
TOOL

Fleet Debt Covenant Headroom, Vessel Valuation Shock, Interest Rates & Refinancing Liquidity Tool

🔔 Subscribe to ShipUniverse Weekly → SHIPUNIVERSE / FLEET FINANCING INTELLIGENCE…

Open →
TOOL

Maritime Freight FFA Hedging, Bunker Price Risk, Margin Calls & Cash-Flow Protection Tool

🔔 Subscribe to ShipUniverse Weekly → SHIPUNIVERSE / FREIGHT DERIVATIVES &…

Open →
TOOL

Empty Container Repositioning, Depot Inventory, Leasing & Shortage Cost Tool

🔔 Subscribe to ShipUniverse Weekly → SHIPUNIVERSE / CONTAINER EQUIPMENT NETWORK…

Open →
TOOL

Subsea Cable Fault Repair, Vessel Spread, Restoration Timeline & Emergency Repair Cost Tool

🔔 Subscribe to ShipUniverse Weekly → SHIPUNIVERSE / SUBSEA EMERGENCY RECOVERY…

Open →
TOOL

Container Shipping Service Contract, Minimum Volume Commitment, Carrier Allocation & Shortfall Cost Tool

🔔 Subscribe to ShipUniverse Weekly → SHIPUNIVERSE / OCEAN FREIGHT PROCUREMENT…

Open →
TOOL

Fleet Retrofit CAPEX Prioritization, Fuel Savings, Decarbonization & Capital Allocation Tool

🔔 Subscribe to ShipUniverse Weekly → SHIP UNIVERSE / FLEET CAPITAL…

Open →
TOOL

Port Container Crane Fleet Replacement,Availability & Lifecycle CAPEX ROI Tool

🔔 Subscribe to ShipUniverse Weekly → SHIP UNIVERSE / TERMINAL ASSET…

Open →
TOOL

Maritime Counterparty Credit, Charter Hire Default, Payment Security & Recovery Exposure Tool

🔔 Subscribe to ShipUniverse Weekly → Charter Risk · Receivables ·…

Open →
TOOL

Cruise Ship Elevator Capacity, Passenger Flow, Outage Risk & Modernization ROI Tool

🔔 Subscribe to ShipUniverse Weekly → Cruise Operations · Hotel Engineering…

Open →
TOOL

Ship Lay-Up, Preservation, Reactivation & Return-to-Service Economics Tool

🔔 Subscribe to ShipUniverse Weekly → Shipowner Strategy · Vessel Preservation…

Open →
TOOL

Maritime Cyber Incident Recovery, OT Downtime, Business Interruption & Restoration Cost Tool

🔔 Subscribe to ShipUniverse Weekly → Maritime Cyber Resilience · Vessel…

Open →
TOOL

Vessel Technical Management Contract Tender, Fleet OPEX, Fees & SLA Comparison Tool

🔔 Subscribe to ShipUniverse Weekly → Ship Management · Fleet OPEX…

Open →
TOOL

Shipbuilding Refund Guarantee, Yard Credit Risk, Progress Payments & Delivery Default Tool

🔔 Subscribe to ShipUniverse Weekly → Shipbuilding Finance · Newbuilding Security…

Open →
TOOL

Port Waste Reception, MARPOL Delivery Notice, Disposal Logistics & Charge Verification Tool

🔔 Subscribe to ShipUniverse Weekly → Port Operations · MARPOL Waste…

Open →
TOOL

Maritime Crew Recruitment, Retention, Manning Agency Fees & Attrition Cost Tool

🔔 Subscribe to ShipUniverse Weekly → ShipUniverse · Fleet Crewing Economics…

Open →
TOOL

Container Rail Intermodal Connection, Terminal Dwell & Train Slot Tool

🔔 Subscribe to ShipUniverse Weekly → Ship-to-Rail · Intermodal Terminal ·…

Open →
TOOL

Bulk Grain Cargo Quality, Fumigation, Hold Readiness & Rejection Exposure Tool

🔔 Subscribe to ShipUniverse Weekly → Cargo quality · Hold inspection…

Open →
TOOL

Marine Equipment OEM Warranty, Service SLA & Repair Claim Tool

🔔 Subscribe to ShipUniverse Weekly → Equipment Reliability · OEM Claims…

Open →
TOOL

Freight Forwarder Shipment Quotation, Buy/Sell Rates, Routing & Margin Tool

🔔 Subscribe to ShipUniverse Weekly → Freight forwarding · NVOCC pricing…

Open →
TOOL

Ro-Ro Vehicle Terminal Yard Capacity, PDI & Vessel Loading Flow Tool

🔔 Subscribe to ShipUniverse Weekly → Vehicle terminals · PCTC &…

Open →
TOOL

Marine Hull & P&I Renewal, Premium Quote, Deductible & Coverage Comparison Tool

🔔 Subscribe to ShipUniverse Weekly → Marine Insurance · Renewal Tender…

Open →
TOOL

Offshore Support Vessel Charter Bid, Utilization & Campaign Profitability Tool

🔔 Subscribe to ShipUniverse Weekly → Offshore commercial operations · PSV…

Open →
TOOL

Marine Repair Tender, Shipyard Bid Comparison & Contract Cost Risk Tool

🔔 Subscribe to ShipUniverse Weekly → Ship Repair Procurement · Yard…

Open →