
🔔 Subscribe to ShipUniverse Weekly →
How a Portside Backlog in the U.S. Could Disrupt Global Trade Flows, Inflate Shipping Costs, and Unravel Supply Chain Stability.
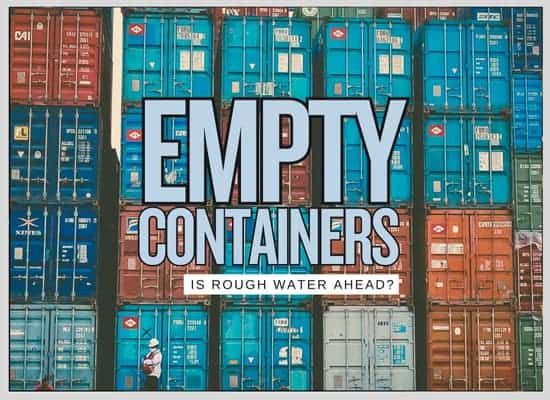
At first glance, a stack of empty shipping containers sitting idle at U.S. ports might not seem like a crisis. But in global logistics, container movement is a carefully balanced ecosystem — one that functions smoothly only when every container keeps moving, full or empty. For years, major ports, shipping lines, and inland transport networks have synchronized this flow to prevent bottlenecks. Now, that system could be breaking. Tariffs, trade imbalances, and port congestion are causing a surpluses of empty containers at U.S. terminals — and the consequences could ripple far beyond American shores. What looks like a local logistics hiccup is quickly becoming a global shipping liability.
We welcome your feedback, suggestions, corrections, and ideas for enhancements. Please click here to get in touch.
⚖️ A Delicate System Disrupted
The global container system runs on balance. Empty containers, though not generating revenue directly, are essential to the next leg of trade. Their movement is part of a tightly managed cycle that ensures goods keep flowing and costs remain predictable.
In normal conditions:
- Empty containers arriving in the U.S. are quickly turned around — either filled with exports or repositioned to Asia.
- Carriers, ports, and leasing firms coordinate container flow to avoid buildup or shortages.
- The system absorbs imbalances with efficiency, keeping global trade fluid.
But that balance is beginning to break down:
- U.S. ports are seeing a surge in empty containers, with fewer exports and slower inland movement.
- Delays in returning empties to Asia are contributing to shortages in manufacturing hubs.
- The result is a growing global mismatch — with some regions overwhelmed by empty containers and others critically short.
What was once a routine backend process is turning into a bottleneck with global consequences.
Ship Universe Calculator: Estimate Empty Container Impact
| Empty Containers Delayed: | |
| Average Delay (Days): | |
| Daily Cost per Container (USD): | |
| Region (for context only): | |
| 🌐 Estimated Global Ripple Effects Will Appear Here | |
| Disclaimer: This calculator provides estimates based on trade data and historical disruption patterns. It is intended for informational purposes only and should not be relied upon as a substitute for professional forecasting. | |
🔄 The Normal Flow of Global Containers
Under normal conditions, container logistics is one of the most choreographed systems in global trade. Containers don’t just move cargo — they move in loops, governed by cycles of demand, repositioning, and leasing.
🌐 The Typical Flow of Global Containers
Under normal trade conditions, shipping containers move in a tightly managed loop between manufacturing hubs, consumer markets, and export zones. Here's how the flow typically works:
- Full Containers Depart from Asia
Most containers begin their cycle in manufacturing-heavy regions like China, Vietnam, or South Korea. These are loaded with finished goods — electronics, textiles, machinery — and shipped to high-consumption markets like the United States and Europe. - Arrival at U.S. Ports
The containers are unloaded at major entry points such as Los Angeles/Long Beach, New York/New Jersey, Savannah, or Houston. Once offloaded, the goods are transported inland via truck or rail to warehouses and distribution centers. - Empty Containers Move Inland or Sit Temporarily at Port
After delivery, empty containers are either:- Returned to the port quickly for repositioning
- Sent inland to areas where exporters (e.g., grain or scrap metal producers) will reload them for outbound shipments
- Containers Used for U.S. Exports (When Available)
If U.S. export demand exists, the empties are reloaded and sent overseas. Common exports include agricultural goods, raw materials, recyclables, and industrial equipment. - Repositioning to Asia or Global Hubs
If no export cargo is available, the empty containers are repositioned — sent back across the Pacific or redirected to other regions where they’re needed. This often happens on the return voyage of ships that brought goods into the U.S. - Return to Origin and Cycle Restarts
Once back in Asia, the containers are prepped for another export load, completing the loop.
🔄 What Makes This Flow Work Smoothly:
- Predictable Import/Export Ratios
Carriers forecast container needs and reposition empties accordingly. - Efficient Port Operations
Ports rely on fast unloading, short dwell times, and strong coordination with rail/truck systems. - Incentives for Fast Turnover
Demurrage and detention fees discourage shippers from holding onto containers too long. - Leasing Pools and Sharing Agreements
Container leasing companies and alliances allow boxes to move freely across different carriers and trades.
What’s Going Wrong in 2025
A sharp rise in empty containers at U.S. ports signals a breakdown in the usual global logistics flow. Compared to 2023, 2025 has seen significant increases in empty container volumes across nearly all major ports. This is driven by a mix of trade imbalances, labor shortages, inland delays, and shifting shipping strategies.
🔍 Contributing Factors
The rise in empty container accumulation isn’t due to a single issue — it’s the result of multiple compounding disruptions:
- Tariffs and Retaliation
A new round of trade tariffs on Chinese goods has suppressed inbound shipments while retaliatory tariffs abroad have reduced demand for U.S. exports. - Export Drop
Weak agricultural exports, reduced recyclables demand, and manufacturing shifts have left fewer outbound loads to reuse containers. - Inland Transportation Delays
Chassis shortages, rail bottlenecks, and trucking delays mean containers can’t return to port quickly enough, causing terminal space issues. - Labor Shortages
Warehouses, drayage operators, and terminal labor are stretched thin, particularly in ports that rely heavily on seasonal or unionized workforces. - Blank Sailings and Vessel Imbalance
Carriers have canceled some return voyages or skipped ports due to lowered demand, further disrupting the flow and return of containers.
Global Repercussions Already Emerging
The pile-up of empty containers in the U.S. isn’t staying local. Major export hubs in Asia are already experiencing knock-on effects as fewer empty containers make it back in time — leading to a squeeze on availability and rising costs.
Effects Across Key Exporting Nations:
- China: Inland factories in Guangdong and Zhejiang are reporting delays in accessing boxes for finished goods. Time-sensitive exports like electronics and apparel are being rerouted or postponed.
- India: Agricultural and pharma exporters in Nhava Sheva and Chennai face rising leasing costs and are seeing containers diverted to higher-paying routes.
- Vietnam: A growing export hub, Vietnam has seen leasing premiums spike by 20–30% due to a lack of available empties coming in from U.S. Gulf and West Coast ports.
Freight Rate Hikes
- Spot rates from Asia to U.S. West Coast have climbed 12–18% in Q2 2025.
- Premium container leases for guaranteed bookings are now commonplace.
- Carriers are charging priority fees to reposition containers — costs that disproportionately hit small-to-midsize shippers.
Small Shippers Squeezed
- Many small exporters in Asia and importers in the U.S. are:
- Losing space to larger contracted customers
- Unable to secure containers for regular shipments
- Paying 2–3x pre-2024 leasing or spot rates
- Result: Some small shippers are suspending operations or losing contracts altogether.
Economic Fallout by Stakeholder
Below is a structured view of how different players in the global trade ecosystem are being impacted — both in the short term and in the months ahead if the crisis continues.
What can be done? 😕
end tariffs. 🎉🥂
The global shipping system is designed to flow — not to stall. Empty containers, though often overlooked, are the connective tissue of that flow. When they stop moving, the entire system begins to seize up.
What we’re seeing in 2025 isn’t just a logistics issue — it’s a feedback loop:
- Tariffs reduce demand → fewer exports → more empties pile up
- Empties don’t return to Asia → production delays → higher freight rates
- Higher costs pressure small players → market consolidation and supply disruptions
This isn’t theoretical. It’s already happening — in Shanghai factories waiting for empty boxes, in East Coast terminals facing growing backlogs, and in small businesses struggling to secure space for goods they’ve already sold.
Fixing this won’t be simple. But it starts with recognizing that container flow is global — and decisions made in one corner of the world ripple across every supply chain. Port operators, carriers, exporters, and policymakers must shift from reactive tactics to coordinated, system-level strategy.
Because in global trade, timing is everything. And right now, the clock is off.