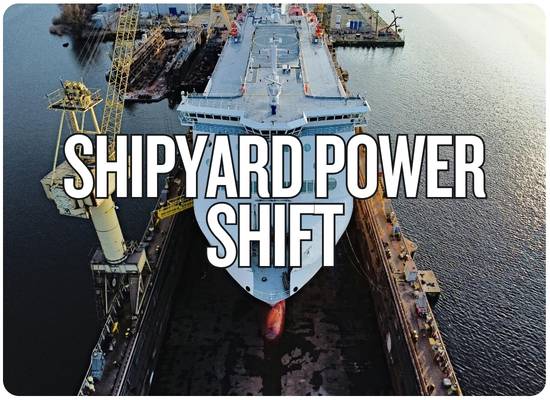
China's Hengli Heavy Industry has captured 23.4% of global shipbuilding orders by compensated gross tonnage across seven major merchant-vessel sectors during the first nine months of 2026, according to Banchero Costa figures reported by Splash on October 30. The Dalian shipyard secured contracts for 276 vessels, including 117 containerships and 100 crude oil tankers, while its outstanding orderbook reached 485 ships. Just four years after Hengli acquired the bankrupt STX Dalian complex, the yard has moved from fifth to first globally in the broker's individual-yard orderbook ranking. Its greatest challenge now is delivery: 199 vessels are scheduled for completion in 2028 alone, compared with just 62 delivered during the first nine months of 2026.
ShipUniverse | Shipbuilding Power Shift
One Yard. 276 Orders. 23.4% of the Market.
The former STX Dalian facility has become the leading individual shipyard in a seven-sector merchant-newbuilding market measured by compensated gross tonnage. Its order intake has outpaced established competitors.
23.4%
2026 new-order share
January–September contracting CGT across seven major vessel sectors
485
Ships on order
Outstanding orderbook at the end of the broker's reporting period
11.2%
Orderbook CGT share
First among individual yards in the same seven-sector universe
New contracting share / January–September 2026
Hengli Heavy Industry
23.4%
Hudong-Zhonghua
7.1%
HD Hyundai H.I.
6.9%
Bars use a common 25% axis maximum. The comparison covers individual shipyards, not consolidated shipbuilding groups. In 2025, Hengli's annual new-contracting CGT share was 9.4% on the broker's reported basis.
276 newly contracted ships / Reported vessel mix
117Containerships
100Crude tankers
39Bulk carriers
20Other / categories not specified in report
The three expressly identified vessel categories total 256 ships. The remaining 20 are the arithmetic difference from 276; their individual types are not established by the published breakdown.
Industrial restart to scheduled delivery surge
2022
Restart
Former STX Dalian assets acquired
Acquisition
2024
4
Vessels delivered
Completed
2025
17
Vessels delivered
Completed
2026 / 9mo
62
Vessels delivered through September
Completed
2027–28
298
Combined scheduled deliveries: 99 in 2027 and 199 in 2028
Scheduled
Data: Banchero Costa figures as reported by Splash247, October 30, 2026; acquisition history cross-checked against 2022 reports. CGT is a workload-adjusted shipbuilding measure. Contracted ships, ships currently on order and vessels already delivered are separate categories.
ShipUniverse | Shipyard Delivery Pressure
The 2028 Delivery Wall
Hengli's ship count is expected to grow faster than its recent completed-vessel production. The next two years will test the yard's ability to turn new infrastructure into reliable deliveries.
Completed output versus scheduled deliveries
2024Actual
4
2025Actual
17
2026Annualized*
82.7
2027Scheduled
99
2028Scheduled
199
*The 2026 figure is a ShipUniverse straight-line annualization of 62 actual deliveries in nine months (62 × 12 ÷ 9). It is not full-year guidance. All bars measure vessel counts, not CGT; vessels may differ substantially in construction work content.
2.41×Required rise in annual vessel count199 scheduled for 2028 compared with 82.7 annualized from the first nine months of 2026.
3.5×CGT production comparisonBanchero Costa estimates 2028 scheduled CGT at about 3.5 times the 2026 annualized CGT production rate.
12.6%Global 2028 delivery workloadHengli's scheduled share of global deliveries by CGT in the broker's seven merchant sectors.
Where the production chain could tighten
Scenario assessment of potential constraints, not confirmed delays or supplier shortages.
Production stage
Available evidence
Possible congestion point
Commercial exposure
Indicator to monitor
Steel processing & block fabrication
Hengli reports 3m tonnes of annual steel-processing capability and continuing workshop expansion.
Plate cutting, panel-line output, welding throughput and completion of prefabricated hull blocks.
Delay in steelwork can consume dock time and disrupt subsequent ship construction sequences.
Actual monthly steel throughput, completed blocks and workshop commissioning.
Dry dock & berth turnover
Four large dry docks and parallel construction infrastructure are reported by the company.
Number of ships that can be assembled, launched and cleared for the next hull series.
A late undocking can delay multiple vessels sharing the same production facility.
Keel laying, float-out and docking intervals across different vessel classes.
Main engines & critical machinery
The company states annual manufacturing capability of 300 marine engines.
Availability of model-specific engines, dual-fuel components, propulsion systems and ancillary equipment.
Machinery delays may extend outfitting periods even after hull construction is largely finished.
Engine production against delivery schedules, factory acceptance testing and supplier lead times.
Electrical systems & outfitting
The 2026 intake includes large containerships and crude tankers requiring extensive installed equipment.
Higher work content can cause delivery delays without an equivalent decline in ships being launched.
Time from launch to commissioning, remaining work lists and equipment acceptance.
Trials, inspection & handover
The broker schedules 199 deliveries for 2028, averaging approximately 16.6 ships monthly.
Sea-trial slots, commissioning crews, class surveys, defect corrections and handover documentation.
Late delivery may postpone employment, charter commencement or financing milestones.
Completed sea trials, first-pass acceptance, contractual versus actual delivery dates.
Owner and supplier coordination
Hengli's contracted vessel mix spans several ship types, with deliveries extending over multiple years.
Owner-furnished equipment, specification changes, subcontractor availability and synchronized milestone approvals.
Variation orders or late decisions can affect cost and schedule even when yard capacity exists.
Approved drawings, equipment readiness, change orders and delivery extensions.
CONTINUED TABLE / HORIZONTAL SCROLL
Interpretation: Scheduled deliveries are not completed deliveries. The 2.41× figure compares annualized ship counts; the 3.5× figure is a CGT comparison attributed to Banchero Costa as reported by Splash. CGT adjusts for vessel type and size, so the two ratios are not interchangeable.
ShipUniverse Interactive Tool | Shipyard Capacity
Can Hengli Clear Its 2028 Delivery Wall?
Stress-test planned ship deliveries against different achievable yard production levels. Model how an unfinished 2027 vessel backlog affects 2028 commitments and estimate hypothetical commercial exposure from delayed ships.
01 / Production capacity scenarios
02 / Delivery schedule and capacity
Banchero Costa reported schedule
Banchero Costa reported schedule
03 / Hypothetical shipowner exposure
Calculation rules: The model prioritizes unfinished 2027 vessels in 2028, then applies remaining 2028 capacity to ships due that year. Unused 2027 production capacity cannot be transferred to 2028 or assumed to deliver future ships early. Annual capacity is entered in vessels, not CGT. The schedule values are broker-reported; achievable production, days delayed and daily costs are hypothetical.
04 / Modeled delivery outcome
Ships unfinished at end of 2028
49 vessels
Scheduled for delivery in 2027–28 but still awaiting completion under the selected capacity assumptions.
0
2027 ships carried into 2028
150
2028 vessels completed on schedule under modeled prioritization
16.6/mo
Required 2028 delivery cadence, including any 2027 backlog
2.41×
Scheduled 2028 ships compared with 2026 annualized output
2028 Delivery Capacity Versus Commitments
2028 workload, including carryover199 ships
Completed under assumed capacity150 ships
150 of 199 ships completed in 2028. The remaining 49 are carried into 2029 or later.
Hypothetical replacement-charter exposure
$147.0m
49 delayed ships × 120 assumed days × $25,000 per day. Illustrative exposure only; not a forecast of actual losses, penalties, compensation or legal liability.
2028 Capacity Sensitivity
Change only the assumed 2028 maximum deliveries. The selected 2027 backlog and reported 2028 schedule remain unchanged.
100 vessels / year
99Ships unfinished after 2028
150 vessels / year
49Ships unfinished after 2028
200 vessels / year
0Ships unfinished after 2028
ShipUniverse Tool disclaimer: This is a deterministic scenario model, not a prediction of Hengli Heavy Industry's production performance. It does not use undisclosed ship-specific construction schedules, expected completion dates, ship size, CGT, contract penalties or actual owner charter coverage. Reported 99 and 199 deliveries are future scheduled values, not guaranteed outcomes. The financial example assumes that every vessel remaining unfinished at the end of 2028 incurs the selected replacement-charter days and rate; actual delays and commercial consequences will differ. The model does not count any temporary delay for a 2027 vessel subsequently delivered during 2028.
Feedback Welcome
We welcome your feedback, suggestions, corrections, and ideas for enhancements.