Shanghai Port’s 203,881 TEU Day Raises the Bar for Global Container Hubs
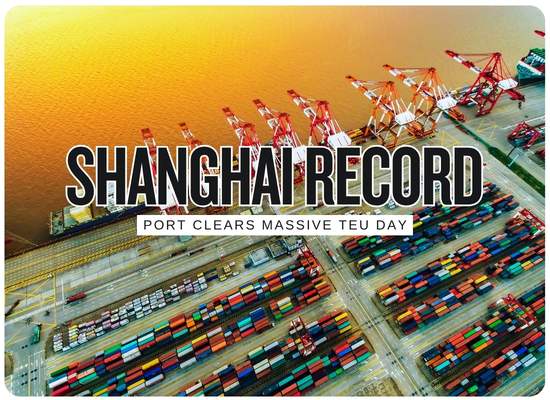
Shanghai Port has reportedly pushed its daily container record to 203,881 TEU, a number that would move the world’s busiest container gateway into a new operating tier for single-day throughput. The figure comes only weeks after official sources showed Shanghai setting a 187,312 TEU day record in June, along with a 68,088 TEU single-shift mark, adding to a year already defined by heavy volumes, dense liner calls, automated terminal performance, and expanding multimodal connections across the Yangtze River Delta.
Ship Universe Port Performance Watch
Operator Impact Snapshot
A 203,881 TEU day would place Shanghai in a new single-day operating class.
The record signals extreme port productivity, but it also raises the pressure on landside links, yard planning, feeder networks, and inland delivery timing.
Terminal productivity signal
Moving more than 200,000 TEU in one day points to deep berth capacity, strong crane planning, and tight operating coordination.
Landside flow pressure
A port-side record can quickly push pressure into trucks, rail, barges, depots, empty equipment, and warehouse appointment systems.
Congestion conversion risk
The key operating test is whether the record clears smoothly or converts into yard density, dwell time, gate bunching, and missed connections.
Carrier schedule impact
Carriers gain value when high berth productivity supports schedule recovery, but bunching can still affect alliance rotations and feeder timing.
Automation investment signal
The number supports continued spending on terminal operating systems, automated equipment, remote operations, sensors, and yard optimization.
Shanghai Record Board
Daily Record, Port Scale, and Supply-Chain Signals
The new mark adds another data point to Shanghai’s run of record container performance.
Record Context
Reported new single-day container throughput mark for Shanghai Port.
Officially reported June record that the new figure would surpass.
Shanghai started 2026 with a monthly container-throughput record.
Shanghai remained the world’s busiest container port for the 16th consecutive year.
Operator Table
| Issue Area | Latest Detail | Market Effect | Stakeholder Move | Pressure Meter |
|---|---|---|---|---|
| Daily Throughput Record 203,881 TEU reported | The new figure would exceed the earlier 187,312 TEU single-day mark by more than 16,000 TEU. | Confirms Shanghai’s ability to handle extreme daily surges across terminals, vessels, and inland links. | Watch whether the surge clears through yard, rail, barge, gate, and depot systems without rising dwell time. |
High
|
| Carrier Network Effect Alliance hub pressure | Very high daily throughput supports large mainline vessel calls, feeder relays, and transshipment coordination. | Schedule recovery improves if high lifts are matched by berth reliability and fast container release. | Compare berth windows, cut-off changes, rolled cargo, feeder timing, and blank-sailing recovery. |
Medium High
|
| Yard Density Post-record stress point | A record lift day can place heavy pressure on container stacks if pickups and onward moves lag. | Yard congestion can erase crane productivity gains by slowing future vessel work and gate flow. | Monitor dwell, rehandles, empty repositioning, reefer plugs, inspection holds, and truck appointment slots. |
Watch
|
| Sea-Rail and Barge Links Hinterland release valve | Record port days need strong inland legs to prevent cargo from staying inside the terminal system too long. | Multimodal capacity becomes a competitive advantage for cargo owners seeking predictable inland delivery. | Track rail slots, barge departures, inland-port capacity, equipment balance, and regional warehouse intake. |
High
|
| Automation and Systems Digital operating layer | Ultra-high daily throughput depends on terminal operating software, automated equipment, remote control, and real-time scheduling. | Suppliers of automation, sensors, OCR, AI planning, crane systems, and yard optimization gain stronger commercial relevance. | Evaluate TOS upgrades, predictive yard models, gate automation, crane sequencing, and berth simulation tools. |
High
|
| Benchmark Pressure Global port comparison | Shanghai’s new daily mark raises expectations for other mega-hubs competing on reliability and throughput. | Port customers may ask harder questions about crane rates, berth delays, extended gates, and inland connectivity elsewhere. | Use the record as a benchmark for capacity planning, not a guarantee of repeatable daily flow. |
Medium
|
Port Surge Capacity Calculator
Estimate record-day lift growth, monthly run-rate, gate pressure, and yard-risk signal after a major container surge.
This tool helps terminal operators, carriers, forwarders, equipment suppliers, and cargo owners screen whether a record throughput day is likely to clear smoothly or create downstream pressure.
Gain Over Prior Record
+8.8%
Estimated increase from the previous record-day benchmark.
Monthly Run-Rate
6.1M TEU
Record-day volume annualized into a 30-day monthly pace.
Surge Above Average
+35.0%
Estimated lift above normal daily flow.
Yard Pressure TEU
157,110
Rough TEU exposure tied to dwell time and yard density assumptions.
Port Surge Signal
The surge is large, but strong automation and multimodal release capacity may keep pressure manageable if dwell stays controlled.
We welcome your feedback, suggestions, corrections, and ideas for enhancements.
Please click here to get in touch