
SHIPUNIVERSE
Maritime Intelligence, Tools & Live Industry Radars

One place for live maritime intelligence, practical decision tools, industry events and focused reporting.

RADARS
TOOLS
All Tools
Latest 20
Open to load latest items…
NEWS
All News
Latest 20
Open to load latest items…
REPORTS
All Reports
Latest 20
Open to load latest items…
TECH
All Tech
Latest 20
Open to load latest items…
CRUISE
All Cruise
Latest 20
Open to load latest items…
NAVAL
All Naval
Latest 20
Open to load latest items…
SHIPUNIVERSE REPORTING

Reports, news and industry coverage

Full analysis in the ShipUniverse intelligence layout.

← Back to latest posts ShipUniverse / NEWS

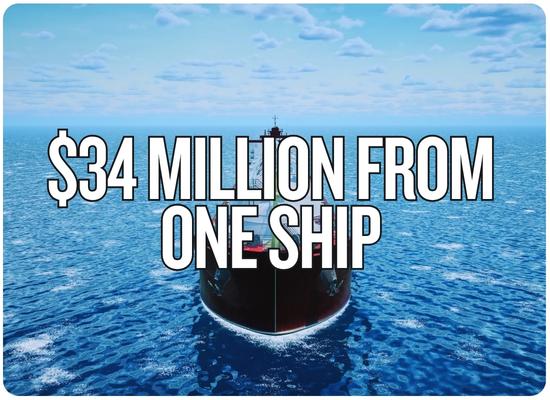
FLEX LNG’s $145.5 Million Ship Deal Could Free $34 Million in Cash. The Catch Is in the Leaseback.

🔔 Subscribe to ShipUniverse Weekly →

FLEX LNG announced on November 11, 2026, that it had signed a $145.5 million sale-and-leaseback financing agreement for its 173,400-cubic-meter LNG carrier Flex Enterprise. Under the agreement with an Asian leasing provider, the 2018-built vessel will be sold to the lessor and chartered back to FLEX LNG on a bareboat basis for approximately six years, with an option to repurchase it at a predetermined price. The company expects the transaction to release approximately $34 million in net cash proceeds after repaying its existing vessel financing. Closing is anticipated in the fourth quarter of 2026, subject to final documentation and customary conditions.

ShipUniverse | LNG Ship Finance | November 2026

One LNG Carrier. $145.5 Million in Financing. $34 Million in New Liquidity.

A proposed bareboat sale-and-leaseback replaces an existing vessel loan with a new six-year leasing structure while preserving FLEX LNG's use of the ship.

New Gross Financing$145.5M

Agreed vessel sale consideration

Expected Net Cash Release~$34M

Subject to closing and loan repayment

Leaseback Period~6 years

Bareboat charterback to FLEX LNG

New Maturity2032

With a predetermined repurchase option

Follow the Financing Proceeds

The old loan balance is from September 30, while the net cash proceeds are management's estimate for a future closing.

01 / NEW FINANCING $145.5M

Gross amount under the signed sale-and-leaseback agreement.

→
02 / OLD FACILITY $110.542M

September 30 debt carrying balance, net of issuance costs, under the $150M facility.

→
03 / EXPECTED LIQUIDITY ~$34M

Cash the company expects to retain after refinancing and closing.

Old debt carrying value$110.542M75.97% of gross amount
Expected cash release~$34.0M23.37% of gross amount
Unreconciled estimate difference~$0.958MNot a disclosed closing-fee amount
The $0.958M difference is arithmetic using the September 30 carrying value and management's approximate net-cash target. It is not evidence that transaction fees total exactly $958,000. Actual outstanding principal, unamortized fees and settlement costs can differ at closing.
The Two Funding Components Behind the JOLCO

FLEX LNG's November 11 investor slide identifies these amounts within the total $145.5M structure.

Fixed-Interest JOLCO Equity Component $64.25M

Approximately 44.2% of the transaction. The investor presentation describes a fixed-interest element associated with this financing component.

Floating-Rate Bank Financing Component $81.25M

Approximately 55.8% of the transaction. The floating component references Term SOFR, subject to contractual terms and any applicable hedging.

The Transaction Timeline
SEPTEMBER 30, 2026$110.542M

Reported carrying value of the existing Flex Enterprise facility.

NOVEMBER 11, 2026Agreement Signed

Company announces the new $145.5M financing agreement.

Q4 2026, EXPECTEDClosing

Old loan is expected to be repaid; net proceeds released if conditions are satisfied.

Source: FLEX LNG's November 11 third-quarter earnings report, pages 1, 6 and 15, and its Q3 investor presentation, funding slide. Announced financing terms are distinguished from actual closing proceeds.
ShipUniverse | Shipping Finance Deep Dive

$34 Million Now. A New Obligation in 2032.

A sale-and-leaseback can release cash immediately while retaining the vessel's earnings potential. But repayment schedules, purchase options and floating-rate exposure still determine the long-term economics.

What the Disclosures Establish

The table distinguishes actual contract terms, management estimates and information not supplied by the announcements.

Financial ItemCompany DisclosureCommercial InterpretationRemaining QualificationStatus
Gross Financing $145.5 million Cash consideration for the ship under the new sale-and-leaseback. Signed, not yet closed. Disclosed
Existing Facility $110.542M carrying balance as of September 30; original $150M facility. The outstanding facility must be repaid from the new transaction. Actual payoff at closing can differ from carrying value. Disclosed
Expected Cash Release Approximately $34 million. Additional liquidity remaining after refinancing. Estimated; subject to conditions and settlement. Forecast
Funding Split $64.25M fixed-interest JOLCO equity; $81.25M floating bank component. Different funding legs have different interest-rate characteristics. Separate component coupons are not disclosed. Disclosed
Blended Funding Cost Approximately SOFR + 25 basis points. Low blended spread, as presented by management. Not the stand-alone bank margin or full lease payment. Blended Metric
Financing Maturity 2032; approximately six-year bareboat lease. Extends the earlier June 2029 debt maturity. Subject to successful closing. Disclosed
2032 Maturity Amount Approximately $78M in the pro forma debt maturity chart. Financing obligations do not disappear over the initial term. Not an exact published buyback exercise price. Pro Forma
Vessel Commercial Charter Firm employment expires Q2 2029 under the current fleet table. The financed vessel may require new employment before its 2032 maturity. Future rechartering terms are unknown. Disclosed
Detailed Lease Cash Schedule Not published in the announcement. Exact amortization, fees, purchase option and cash flows require the final agreement. Cannot derive exact payments from the 21-year age-adjusted metric. Unknown
Do not confuse the 21-year repayment profile with the six-year lease term. The 21-year figure is adjusted for ship age. The exact sequence of repayments and ultimate option price is not fully disclosed by the headline financing announcement.
Two Different 2029 Dates Matter

One concerns the vessel's financing. The other concerns revenue under its present commercial employment agreement.

OLD FINANCING MATURITY June 2029

The existing Flex Enterprise loan is to be refinanced and replaced with a new financing maturity in approximately 2032.

EXISTING VESSEL CHARTER EXPIRATION Q2 2029

The current fleet table lists the firm's commercial charter ending around this time. Financing beyond this date is not matched by publicly confirmed additional charter employment.

A Second Deal Changes Two Other LNG Carriers

The October amendment affects Flex Artemis and Flex Amber under their existing $330M sale-and-leaseback facility, not the new Flex Enterprise agreement.

FINANCING MARGIN 215 → 140 bps

A reduction of 75 basis points in the stated financing margin.

COMBINED QUARTERLY AMORTIZATION $4.3M → $3.5M

Approximately $0.8M less principal paid each quarter on the two-ship facility.

TRADE-OFF Higher Options

The revised schedule lowers periodic payments but increases end-of-lease purchase-option amounts.

Cash-flow relief is not the same as an interest saving. Reducing combined quarterly amortization by $0.8M means approximately $3.2M less principal paid over four quarters at that schedule. It is not a $3.2M reduction in borrowing expense or profit.
Five Questions a Financing Analyst Would Still Ask
01 / REPURCHASEWhat Is the Exact Exercise Price?

The investor chart shows a future maturity amount, but the full option schedule is not disclosed.

02 / INTERESTHow Much Rate Risk Is Hedged?

The company has group-level swaps, but the exact hedge allocation to the new bank-funded portion is not stated.

03 / AMORTIZATIONWhat Are the Scheduled Lease Payments?

Payment dates and allocations to financing versus principal are needed for a cash-flow forecast.

04 / CHARTERWhat Happens After Q2 2029?

Future charter hire and utilization will affect the ability to carry financing obligations through 2032.

05 / ALLOCATIONHow Will the Cash Be Used?

The company has dividend commitments and liquidity needs, but the $34M refinancing proceeds have not been assigned to a specific new project or distribution.

Financial conclusion: The refinancing can increase near-term cash and extend one maturity while preserving use of Flex Enterprise. It does not eliminate leverage. The effect on future cash generation will depend on lease payments, interest rates, commercial charter earnings and the amount due at the end of the arrangement.
ShipUniverse | Interactive Ship Finance Tool

Sale-and-Leaseback: How Much Cash Does the Owner Really Unlock?

Model gross financing, existing debt payoff, floating-rate sensitivity, future principal repayments and the remaining debt exposure at lease maturity. Advanced mode adds vessel earnings and cash debt-service coverage.

Official disclosures versus modeling assumptions: FLEX LNG's $145.5M financing, approximately $34M projected net cash, six-year charterback, and $81.25M floating funding component are company disclosures. The example amortization schedule and $0.958M illustrative closing adjustment are not contractual terms.
1. Financing and Liquidity Inputs

All financing amounts are in USD millions unless otherwise indicated. Values are editable for other vessels and transactions.

Disclosed Flex Enterprise sale consideration.
September 30 debt carrying value, not a verified closing payoff.
Illustrative amount balancing the public figures to ~$34M.
Disclosed term is approximately six years.
Illustrative straight-line repayment, not the actual JOLCO schedule.
Company's investor slide assumes 3.90% for its illustration.
Published blended equivalent: SOFR plus approximately 0.25 points.
Actual financing split identifies $81.25M of bank funding.
+1.00 means a 100-basis-point increase in reference rates.
2. Where the New Financing Goes
The analysis shows the estimated debt replacement, additional liquidity and entered transaction adjustments.
New Funds$145.50M

Gross financing received at assumed closing.

Debt Replacement$110.54M

Old financing retired under the scenario.

Net New Cash$34.00M

Liquidity remaining after entered costs and payoff.

Blue: old debt payoff. Green: net cash retained. Amber: modeled closing adjustment. Bar allocations reflect gross financing and do not represent real escrow or settlement balances.
3. Illustrative Debt Balance Over the Lease

Annual straight-line principal reduction is a simplifying assumption. The published age-adjusted repayment profile does not establish a straight-line contractual amortization schedule.

Expected Net Liquidity Scenario$34.00M

Gross proceeds less old debt and entered transaction expenses.

Initial Blended Interest Cost Proxy$6.04M

First-year opening balance multiplied by reference blended rate.

First-Year Principal Plus Interest$17.29M

Illustrative annual cash debt service, excluding other lease obligations.

Debt Remaining at End of Term$78.00M

Model-generated residual, not a contractual buyback quote.

Total Modeled Interest Over Term$29.23M

Declining-balance calculation at a constant illustrative rate.

+/- Rate Shock, First-Year Effect$0.81M

Based on the unhedged floating funding component only.

Reference Blended Funding Rate4.15%

Term SOFR reference plus entered blended spread.

First-Year Interest vs Old FacilityAdvanced

Requires an assumed old-loan interest rate.

Vessel Cash Debt-Service CoverageAdvanced

Requires earning days, charter rate, operating costs and overhead.

Liquidity Rises, But Debt Does Not Disappear

The modeled refinancing releases cash at closing but leaves repayment and future maturity obligations.

Cash calculation: Net new liquidity equals new gross financing proceeds minus the entered old-debt payoff and assumed closing costs. Negative results indicate additional cash needed rather than liquidity released. Debt schedule: For each modeled year, the opening financed balance is reduced by the lesser of the remaining balance or the entered annual principal repayment. Final residual equals the debt remaining after those repayments. Default inputs happen to produce a $78M balance, broadly matching the 2032 amount in the company's investor maturity chart, but the contractual annual repayment schedule was not disclosed. Illustrative interest: A blended rate proxy is calculated by adding the entered reference SOFR and blended spread. First-year interest is approximated by applying it to the opening balance. Subsequent modeled years apply it to the remaining opening balances. The actual lease has different fixed and floating funding components, so this is not a contract-specific interest or bareboat-hire quotation. Floating sensitivity: The initial floating funding component multiplied by the assumed interest-rate change estimates the first-year change in unhedged interest expense. Advanced mode reduces the amount by the selected hypothetical hedge fraction. This sensitivity does not include changes in the fixed-interest portion, derivative market value, amortization timing or hedge-basis effects. Advanced earnings: Annual TCE contribution equals earning days times TCE per earning day. Operating cash before debt service equals TCE contribution minus daily OPEX multiplied by 365 calendar days, entered overhead and optional cash reserves. The debt-service coverage proxy divides that result by modeled first-year principal and interest. It is not a lender-defined covenant DSCR. Financial limitations: Sale-and-leaseback cash proceeds are financing, not operating profit. The calculator does not model taxes, accounting gain or loss, depreciation, repurchase-option valuation, exact JOLCO equity cash flows, covenants, termination terms, lease security or full hedge designation. A balloon or option payment must be considered separately from recurring financing cost. All figures are illustrative USD, not an investment recommendation.
Feedback Welcome

We welcome your feedback, suggestions, corrections, and ideas for enhancements.

Please click here to get in touch
By the ShipUniverse Editorial Team — About Us | Contact


← Browse more ShipUniverse posts
MARITIME DECISION TOOLS

Practical tools for real vessel and commercial decisions

Browse the latest 24 tools or instantly search every published ShipUniverse maritime tool.

24 latest toolsView all 306 →
TOOL

Harbor Tug Fleet Contract Tender, Utilization, Standby Fees & Towage Profitability Tool

🔔 Subscribe to ShipUniverse Weekly → SHIPUNIVERSE / PORT & TOWAGE…

Open →
TOOL

Marine General Average, Cargo Contribution, Security Deposits & Claims Settlement Exposure Tool

🔔 Subscribe to ShipUniverse Weekly → SHIPUNIVERSE / MARITIME CLAIMS &…

Open →
TOOL

Chemical Tanker Cargo Parcel Allocation, Tank Compatibility, Cleaning Turnaround & Voyage Margin Tool

🔔 Subscribe to ShipUniverse Weekly → SHIP UNIVERSE / CHEMICAL TANKER…

Open →
TOOL

Marine Insurance Claims Portfolio, Hull & P&I Loss Runs, Reserves & Renewal Negotiation Tool

🔔 Subscribe to ShipUniverse Weekly → SHIPUNIVERSE / FLEET INSURANCE &…

Open →
TOOL

Offshore Platform Decommissioning, Vessel Spread, Weather Windows & Removal Campaign Cost Tool

🔔 Subscribe to ShipUniverse Weekly → SHIPUNIVERSE / OFFSHORE ASSET RETIREMENT…

Open →
TOOL

Tanker & Bulker Commercial Pool, Fleet Earnings Distribution, Off-Hire & Pooling Economics Tool

🔔 Subscribe to ShipUniverse Weekly → SHIPUNIVERSE / COMMERCIAL SHIPPING INTELLIGENCE…

Open →
TOOL

Port Terminal Concession Bid, Throughput Guarantees, Tariff Escalation & Investment NPV Tool

🔔 Subscribe to ShipUniverse Weekly → SHIPUNIVERSE / PORT INFRASTRUCTURE INVESTMENT…

Open →
TOOL

Fleet Debt Covenant Headroom, Vessel Valuation Shock, Interest Rates & Refinancing Liquidity Tool

🔔 Subscribe to ShipUniverse Weekly → SHIPUNIVERSE / FLEET FINANCING INTELLIGENCE…

Open →
TOOL

Maritime Freight FFA Hedging, Bunker Price Risk, Margin Calls & Cash-Flow Protection Tool

🔔 Subscribe to ShipUniverse Weekly → SHIPUNIVERSE / FREIGHT DERIVATIVES &…

Open →
TOOL

Empty Container Repositioning, Depot Inventory, Leasing & Shortage Cost Tool

🔔 Subscribe to ShipUniverse Weekly → SHIPUNIVERSE / CONTAINER EQUIPMENT NETWORK…

Open →
TOOL

Subsea Cable Fault Repair, Vessel Spread, Restoration Timeline & Emergency Repair Cost Tool

🔔 Subscribe to ShipUniverse Weekly → SHIPUNIVERSE / SUBSEA EMERGENCY RECOVERY…

Open →
TOOL

Container Shipping Service Contract, Minimum Volume Commitment, Carrier Allocation & Shortfall Cost Tool

🔔 Subscribe to ShipUniverse Weekly → SHIPUNIVERSE / OCEAN FREIGHT PROCUREMENT…

Open →
TOOL

Fleet Retrofit CAPEX Prioritization, Fuel Savings, Decarbonization & Capital Allocation Tool

🔔 Subscribe to ShipUniverse Weekly → SHIP UNIVERSE / FLEET CAPITAL…

Open →
TOOL

Port Container Crane Fleet Replacement,Availability & Lifecycle CAPEX ROI Tool

🔔 Subscribe to ShipUniverse Weekly → SHIP UNIVERSE / TERMINAL ASSET…

Open →
TOOL

Maritime Counterparty Credit, Charter Hire Default, Payment Security & Recovery Exposure Tool

🔔 Subscribe to ShipUniverse Weekly → Charter Risk · Receivables ·…

Open →
TOOL

Cruise Ship Elevator Capacity, Passenger Flow, Outage Risk & Modernization ROI Tool

🔔 Subscribe to ShipUniverse Weekly → Cruise Operations · Hotel Engineering…

Open →
TOOL

Ship Lay-Up, Preservation, Reactivation & Return-to-Service Economics Tool

🔔 Subscribe to ShipUniverse Weekly → Shipowner Strategy · Vessel Preservation…

Open →
TOOL

Maritime Cyber Incident Recovery, OT Downtime, Business Interruption & Restoration Cost Tool

🔔 Subscribe to ShipUniverse Weekly → Maritime Cyber Resilience · Vessel…

Open →
TOOL

Vessel Technical Management Contract Tender, Fleet OPEX, Fees & SLA Comparison Tool

🔔 Subscribe to ShipUniverse Weekly → Ship Management · Fleet OPEX…

Open →
TOOL

Shipbuilding Refund Guarantee, Yard Credit Risk, Progress Payments & Delivery Default Tool

🔔 Subscribe to ShipUniverse Weekly → Shipbuilding Finance · Newbuilding Security…

Open →
TOOL

Port Waste Reception, MARPOL Delivery Notice, Disposal Logistics & Charge Verification Tool

🔔 Subscribe to ShipUniverse Weekly → Port Operations · MARPOL Waste…

Open →
TOOL

Maritime Crew Recruitment, Retention, Manning Agency Fees & Attrition Cost Tool

🔔 Subscribe to ShipUniverse Weekly → ShipUniverse · Fleet Crewing Economics…

Open →
TOOL

Container Rail Intermodal Connection, Terminal Dwell & Train Slot Tool

🔔 Subscribe to ShipUniverse Weekly → Ship-to-Rail · Intermodal Terminal ·…

Open →
TOOL

Bulk Grain Cargo Quality, Fumigation, Hold Readiness & Rejection Exposure Tool

🔔 Subscribe to ShipUniverse Weekly → Cargo quality · Hold inspection…

Open →