
🔔 Subscribe to ShipUniverse Weekly →
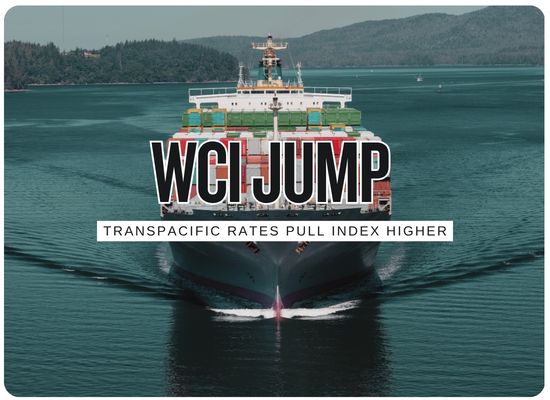
Drewry’s latest World Container Index moved higher for the third straight week, rising 4% on August 20 to $4,526 per 40ft container. The increase was led by another strong move on the Transpacific, where Shanghai to New York climbed to $9,507 and Shanghai to Los Angeles reached $6,802, both up 9% for the week. Asia-Europe moved in the opposite direction, with Shanghai to Genoa slipping to $4,955 and Shanghai to Rotterdam easing to $4,401. The report described a container market being pulled in different directions at once: resilient U.S.-bound demand, tighter Transpacific capacity, announced Panama Canal surcharges, limited Asia-Europe blank sailings, port congestion in Asia and Europe, German port strike disruption, selected Red Sea and Suez Canal resumptions, and unresolved Hormuz risk after the U.S.-Iran Strait of Hormuz MoU expired without a lasting settlement.
Ship Universe Container Rate Watch
Operator Impact Snapshot
The composite WCI rose again, but the real story is the widening split between U.S.-bound lanes and Asia-Europe lanes.
Transpacific pricing power
Shanghai to New York and Shanghai to Los Angeles both rose 9%, making U.S.-bound freight the main force behind the weekly gain.
Composite index momentum
The WCI climbed 4% to $4,526 per 40ft container, marking a third consecutive weekly increase.
Europe lane softness
Asia-Europe rates moved lower again, with both Genoa and Rotterdam losing ground while Transpacific rates advanced.
Capacity management support
Drewry pointed to seven Transpacific blank sailings next week and reduced Asia to U.S. East Coast capacity in August.
Disruption stack remains active
Panama Canal surcharges, German port labor disruption, congestion, Red Sea uncertainty and Hormuz risk are still feeding the all-in cost picture.
WCI Rate Board
Transpacific Strength Carries the Composite Higher
The latest report is a lane-divergence story, not a clean global rate rally.
Up 4% per 40ft container, the third consecutive weekly increase.
Up 9% for the week, the highest major lane figure in the latest assessment.
Up 9%, showing that West Coast rates also remain under pressure.
Drewry said August capacity declined 9% month over month on Asia to U.S. East Coast.
| Lane or Driver | Latest Figure | Market Signal | Commercial Effect | Pressure Meter |
|---|---|---|---|---|
| Composite WCIGlobal benchmark | $4,526 per 40ft, up 4%. | A third weekly gain shows renewed support after the late-July dip. | Index-linked contracts and spot exposure both move higher if the gain holds. | High |
| Shanghai to New YorkAsia to U.S. East Coast | $9,507 per 40ft, up 9%. | East Coast pricing remains the strongest major-lane signal. | Panama Canal surcharge exposure and reduced capacity can lift the all-in cost beyond the headline rate. | Severe |
| Shanghai to Los AngelesAsia to U.S. West Coast | $6,802 per 40ft, up 9%. | West Coast rates are also rising despite a smaller August capacity decline. | West Coast routing remains cheaper than East Coast, but the gap is not stopping rate pressure. | High |
| Shanghai to GenoaAsia to Mediterranean | $4,955 per 40ft, down 2%. | The Mediterranean lane is not following the U.S. rate move. | Rate increases may face resistance unless capacity cuts or demand improve. | Watch |
| Shanghai to RotterdamAsia to North Europe | $4,401 per 40ft, down 1%. | North Europe remains soft, even with some congestion still present. | The rate weakness can be offset by reliability issues if port and inland delays persist. | Medium |
| Transpacific Blank SailingsNext-week capacity control | Seven blank sailings announced for next week. | Carriers are continuing to defend rates through supply management. | Fewer sailings can increase rollover risk and reduce booking flexibility. | High |
| Congestion and LaborShanghai, Rotterdam, German ports | Shanghai waiting averaged 32.3 hours and Rotterdam 25.0 hours in week 33, with German strikes adding disruption. | Congestion eased but remains high enough to affect schedule reliability. | The rate number may look stable while transit time and handoff reliability remain unstable. | High |
| Geopolitical Route RiskHormuz, Red Sea and Suez | Hormuz uncertainty remains unresolved while selected Red Sea and Suez transits are gradually returning. | Route confidence is improving in pockets but remains fragile. | Capacity, surcharges and schedule reliability can change quickly if security assessments shift. | High |
WCI Booking Cost and Rollover Pressure Tool
Model the all-in impact of the latest Drewry lane rates, surcharges, capacity tightening and delay exposure.
Ocean Base Cost
$380,280
Selected Drewry lane rate multiplied by 40ft container count.
Total With Surcharges
$406,280
Base ocean freight plus selected surcharge assumptions.
Delay Exposure
$9,000
Modeled cost of rollover, congestion, inland delay or schedule disruption.
Next Move Exposure
$12,188
Estimated freight change if rates move by the selected percentage before booking.
Booking Signal
The model shows elevated booking pressure from high rates, tight space and delay exposure. Cost certainty may matter more than waiting for a small correction.
We welcome your feedback, suggestions, corrections, and ideas for enhancements.
Please click here to get in touch