

SHIPUNIVERSE
Maritime Intelligence, Tools & Live Industry Radars

One place for live maritime intelligence, practical decision tools, industry events and focused reporting.

RADARS
TOOLS
All Tools
Latest 20
Open to load latest items…
NEWS
All News
Latest 20
Open to load latest items…
REPORTS
All Reports
Latest 20
Open to load latest items…
TECH
All Tech
Latest 20
Open to load latest items…
CRUISE
All Cruise
Latest 20
Open to load latest items…
NAVAL
All Naval
Latest 20
Open to load latest items…
SHIPUNIVERSE REPORTING

Reports, news and industry coverage

Full analysis in the ShipUniverse intelligence layout.

← Back to latest posts ShipUniverse / NEWS

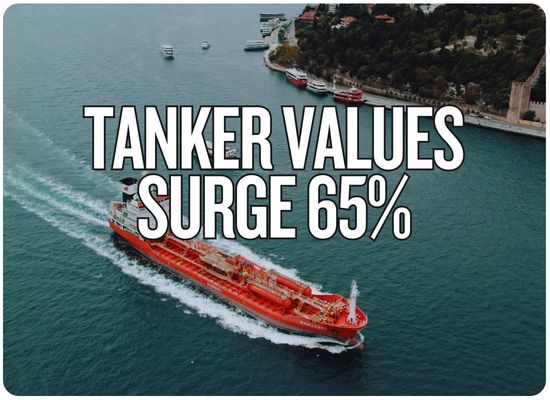
Tanker Values Surge 65% in a Year as New Shanghai Data Reveals a Divided Ship Market

🔔 Subscribe to ShipUniverse Weekly →

The Shanghai Shipping Exchange released its November 11 Shanghai Ship Price Index at 1,313.48 points, up 0.37% from the previous week and 16.71% year over year. Its international tanker price index climbed to 1,881.78, a 65.53% annual increase, while the international dry-bulk index advanced 1.76% for the week to 1,035.59. China's coastal and inland dry-bulk indexes fell 0.48% and 0.27%, respectively. The weekly release shows substantial appreciation in international secondhand tanker and bulk-carrier valuations alongside weaker domestic vessel-price indicators.

ShipUniverse | Weekly Vessel Asset Values | November 11, 2026

Tanker Price Index Surges 65.5% Year Over Year

Shanghai's new ship-price data shows international tankers and bulk carriers gaining value while domestic coastal and river-going bulk ships retreat.

1,313.48Shanghai Ship Price Index, +0.37% weekly
+65.53%International tanker index, year over year
+33.88%International dry-bulk index, year over year
Nov. 11Latest official Wednesday release

International tanker prices lead the market

International tanker price index (TPI) 1,881.78

Up 1.34% from 1,856.89 the previous week. The year-earlier reading was 1,136.84.

International dry-bulk price index (BPI) 1,035.59

Up 1.76% for the week, the strongest percentage increase among the four vessel-sector indexes.

All five indexes: November 11 weekly movements

Shanghai Ship Price Index1,308.68 → 1,313.48 points
+0.37%+16.71% annually
International tankers1,856.89 → 1,881.78 points
+1.34%+65.53% annually
International dry bulk1,017.71 → 1,035.59 points
+1.76%+33.88% annually
Chinese coastal dry bulk1,478.60 → 1,471.51 points
−0.48%+2.35% annually
Chinese inland dry bulk1,043.08 → 1,040.22 points
−0.27%+1.73% annually

Year-over-year index appreciation

International tankers65.53%
International dry bulk33.88%
Shanghai composite16.71%

Domestic asset-market contrast

Coastal bulk, annually+2.35%
Inland bulk, annually+1.73%

Both domestic indexes were up over the past year but declined during the latest week. Bars within each panel have separate comparison scales.

Reading the data: These are ship-price index points, not vessel sale prices in US dollars. The annual 65.53% tanker gain describes an index basket, not the appreciation of every individual tanker or VLCC. The series use April 7, 2010 as the 1,000-point base.

Source: Shanghai Shipping Exchange / China Ship Trading Information Platform, November 11, 2026. Displayed weekly and annual percentages reproduce the official release.

ShipUniverse | Vessel Investment & Finance Intelligence

Strong Global Asset Prices, Weak Domestic Price Momentum

The November 11 release gives vessel investors five market signals. Their implications are very different for tanker assets, bulk fleets and domestic Chinese shipping.

Data basis: November 11, 2026 Shanghai Ship Price Index. The following assessment separates published index observations from potential commercial consequences. A sector index cannot substitute for an individual vessel appraisal.

Sector-by-sector asset-value evidence

Vessel market Nov. 11 Nov. 4 Weekly Annual Investment interpretation
Shanghai composite 1,313.48 1,308.68 +0.37% +16.71% The combined domestic and international benchmark increased, but masks much stronger international ship valuations.
International tankers 1,881.78 1,856.89 +1.34% +65.53% The strongest annual appreciation among the reported segments. Asset purchase prices and collateral assumptions warrant close attention.
International dry bulk 1,035.59 1,017.71 +1.76% +33.88% The fastest weekly advance among the four sector indexes, showing fresh strength outside the tanker market.
Chinese coastal dry bulk 1,471.51 1,478.60 −0.48% +2.35% Modest annual appreciation and a negative latest week. Conditions differ from international bulk trading.
Chinese inland dry bulk 1,040.22 1,043.08 −0.27% +1.73% A relatively flat annual market with slight weekly weakness, not a mirror of international dry-bulk prices.

What is inside the Shanghai methodology?

9International benchmark vessel types

Five tanker classes from product tankers to VLCCs, plus four dry-bulk classes from Handysize to Capesize.

3Coastal benchmark types

Representative domestic tanker and bulk-carrier designs used in the exchange's assessment framework.

5Inland benchmark types

River-going tanker and dry-bulk designs, reflecting a different operating and trading market.

Why the secondhand tanker premium is remarkable

Veson Nautical, end-September reference $218.0M

Estimated value of a representative five-year-old VLCC. Historical external valuation, not a November 11 SPI dollar figure.

Veson Nautical, end-September reference $140.6M

Comparable newbuilding benchmark cited by Veson. New vessels face construction and delivery lead times.

Three distinct financing and investment implications

Sale and purchase

Rapidly rising international vessel values can increase sellers' expectations while raising acquisition prices for buyers seeking immediate employment.

Collateral and refinancing

Changes in an individual ship's independently appraised market value may alter loan-to-value ratios, refinancing capacity and covenant headroom.

Newbuild versus secondhand

Delivery timing and immediately available earnings can explain why existing tankers sometimes command valuations above newbuilding benchmarks.

Important methodological limit: Shanghai's index uses representative five-year-old vessels and a transaction-based assessment process. The 65.53% tanker-index increase is not proof that a particular ship, a different-aged VLCC or a mixed fleet gained 65.53% in market value. The Veson prices are separate, older benchmarks and must not be substituted into the November 11 index.

Sources: Shanghai Shipping Exchange, November 11 index and published methodology; Shanghai Shipping Exchange November 4 weekly commentary; Veson Nautical October 16 vessel-market analysis.

ShipUniverse | Interactive Ship Asset Valuation Tool

What Could the New Shanghai Index Mean for Your Fleet?

Apply November 11 market-index movements to a hypothetical vessel portfolio and examine collateral, equity and sale-value sensitivity.

Fleet valuation inputs

Your own reference estimate, not an SPI price
Advanced sensitivity adjustments
100% = full index-relative movement
Official benchmark movement +1.34% in one week 1,856.89 → 1,881.78 index points
Hypothetical current fleet asset value $344.56M

Index-linked scenario derived from the entered previous vessel value. Not an appraisal or sale quotation.

$86.14MModeled asset value per vessel
+$4.56MChange in modeled fleet asset value
$140.56MModeled fleet equity before sale costs
59.2%Resulting debt-to-asset ratio
$204.00MAssumed unchanged outstanding debt
$135.39MIndicative equity proceeds after selling costs
Scenario shows positive equity after assumed debt.

Fleet valuation versus debt exposure

Earlier fleet value$340.00M
Modeled current fleet value$344.56M
Assumed outstanding debt$204.00M
Method: The selected Shanghai index change is calculated using its exact current and prior readings. The previous vessel value is adjusted by the index-relative movement, multiplied by the Advanced pass-through percentage and then by any additional value shock. Fleet value equals modeled price times vessel count. Debt remains fixed at the entered percentage of the earlier fleet value. Equity equals modeled value less debt; net disposal equity also subtracts entered selling costs.
Valuation limitation: SPI is a market benchmark, not a valuation of the entered vessel. Age, yard, size, classification, equipment, fuel type, condition, earnings, charter commitments, sanctions, currency and liquidity can cause individual ships to move differently from their category index. One-year scenarios are not investment-return calculations and ignore intervening cash flows, depreciation, debt repayment and capital expenditures.

Index values: Shanghai Shipping Exchange release dated November 11, 2026. All vessel prices, financing and sensitivity assumptions are hypothetical and user-editable.

Feedback Welcome

We welcome your feedback, suggestions, corrections, and ideas for enhancements.

Please click here to get in touch
By the ShipUniverse Editorial Team — About Us | Contact


← Browse more ShipUniverse posts
MARITIME DECISION TOOLS

Practical tools for real vessel and commercial decisions

Browse the latest 24 tools or instantly search every published ShipUniverse maritime tool.

24 latest toolsView all 306 →
TOOL

Harbor Tug Fleet Contract Tender, Utilization, Standby Fees & Towage Profitability Tool

🔔 Subscribe to ShipUniverse Weekly → SHIPUNIVERSE / PORT & TOWAGE…

Open →
TOOL

Marine General Average, Cargo Contribution, Security Deposits & Claims Settlement Exposure Tool

🔔 Subscribe to ShipUniverse Weekly → SHIPUNIVERSE / MARITIME CLAIMS &…

Open →
TOOL

Chemical Tanker Cargo Parcel Allocation, Tank Compatibility, Cleaning Turnaround & Voyage Margin Tool

🔔 Subscribe to ShipUniverse Weekly → SHIP UNIVERSE / CHEMICAL TANKER…

Open →
TOOL

Marine Insurance Claims Portfolio, Hull & P&I Loss Runs, Reserves & Renewal Negotiation Tool

🔔 Subscribe to ShipUniverse Weekly → SHIPUNIVERSE / FLEET INSURANCE &…

Open →
TOOL

Offshore Platform Decommissioning, Vessel Spread, Weather Windows & Removal Campaign Cost Tool

🔔 Subscribe to ShipUniverse Weekly → SHIPUNIVERSE / OFFSHORE ASSET RETIREMENT…

Open →
TOOL

Tanker & Bulker Commercial Pool, Fleet Earnings Distribution, Off-Hire & Pooling Economics Tool

🔔 Subscribe to ShipUniverse Weekly → SHIPUNIVERSE / COMMERCIAL SHIPPING INTELLIGENCE…

Open →
TOOL

Port Terminal Concession Bid, Throughput Guarantees, Tariff Escalation & Investment NPV Tool

🔔 Subscribe to ShipUniverse Weekly → SHIPUNIVERSE / PORT INFRASTRUCTURE INVESTMENT…

Open →
TOOL

Fleet Debt Covenant Headroom, Vessel Valuation Shock, Interest Rates & Refinancing Liquidity Tool

🔔 Subscribe to ShipUniverse Weekly → SHIPUNIVERSE / FLEET FINANCING INTELLIGENCE…

Open →
TOOL

Maritime Freight FFA Hedging, Bunker Price Risk, Margin Calls & Cash-Flow Protection Tool

🔔 Subscribe to ShipUniverse Weekly → SHIPUNIVERSE / FREIGHT DERIVATIVES &…

Open →
TOOL

Empty Container Repositioning, Depot Inventory, Leasing & Shortage Cost Tool

🔔 Subscribe to ShipUniverse Weekly → SHIPUNIVERSE / CONTAINER EQUIPMENT NETWORK…

Open →
TOOL

Subsea Cable Fault Repair, Vessel Spread, Restoration Timeline & Emergency Repair Cost Tool

🔔 Subscribe to ShipUniverse Weekly → SHIPUNIVERSE / SUBSEA EMERGENCY RECOVERY…

Open →
TOOL

Container Shipping Service Contract, Minimum Volume Commitment, Carrier Allocation & Shortfall Cost Tool

🔔 Subscribe to ShipUniverse Weekly → SHIPUNIVERSE / OCEAN FREIGHT PROCUREMENT…

Open →
TOOL

Fleet Retrofit CAPEX Prioritization, Fuel Savings, Decarbonization & Capital Allocation Tool

🔔 Subscribe to ShipUniverse Weekly → SHIP UNIVERSE / FLEET CAPITAL…

Open →
TOOL

Port Container Crane Fleet Replacement,Availability & Lifecycle CAPEX ROI Tool

🔔 Subscribe to ShipUniverse Weekly → SHIP UNIVERSE / TERMINAL ASSET…

Open →
TOOL

Maritime Counterparty Credit, Charter Hire Default, Payment Security & Recovery Exposure Tool

🔔 Subscribe to ShipUniverse Weekly → Charter Risk · Receivables ·…

Open →
TOOL

Cruise Ship Elevator Capacity, Passenger Flow, Outage Risk & Modernization ROI Tool

🔔 Subscribe to ShipUniverse Weekly → Cruise Operations · Hotel Engineering…

Open →
TOOL

Ship Lay-Up, Preservation, Reactivation & Return-to-Service Economics Tool

🔔 Subscribe to ShipUniverse Weekly → Shipowner Strategy · Vessel Preservation…

Open →
TOOL

Maritime Cyber Incident Recovery, OT Downtime, Business Interruption & Restoration Cost Tool

🔔 Subscribe to ShipUniverse Weekly → Maritime Cyber Resilience · Vessel…

Open →
TOOL

Vessel Technical Management Contract Tender, Fleet OPEX, Fees & SLA Comparison Tool

🔔 Subscribe to ShipUniverse Weekly → Ship Management · Fleet OPEX…

Open →
TOOL

Shipbuilding Refund Guarantee, Yard Credit Risk, Progress Payments & Delivery Default Tool

🔔 Subscribe to ShipUniverse Weekly → Shipbuilding Finance · Newbuilding Security…

Open →
TOOL

Port Waste Reception, MARPOL Delivery Notice, Disposal Logistics & Charge Verification Tool

🔔 Subscribe to ShipUniverse Weekly → Port Operations · MARPOL Waste…

Open →
TOOL

Maritime Crew Recruitment, Retention, Manning Agency Fees & Attrition Cost Tool

🔔 Subscribe to ShipUniverse Weekly → ShipUniverse · Fleet Crewing Economics…

Open →
TOOL

Container Rail Intermodal Connection, Terminal Dwell & Train Slot Tool

🔔 Subscribe to ShipUniverse Weekly → Ship-to-Rail · Intermodal Terminal ·…

Open →
TOOL

Bulk Grain Cargo Quality, Fumigation, Hold Readiness & Rejection Exposure Tool

🔔 Subscribe to ShipUniverse Weekly → Cargo quality · Hold inspection…

Open →