
🔔 Subscribe to ShipUniverse Weekly →
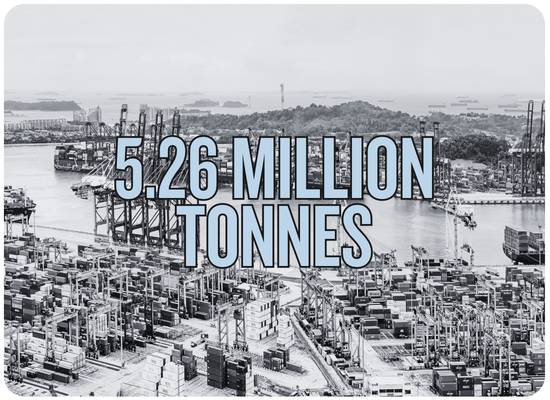
5.26 MILLION TONNES.
4,008 BUNKER CALLS.
ONE UNEVEN MARKET.
Conventional bunkers surged in Singapore while bio-blends fell sharply. Six October market signals reveal where owners should scrutinize price, availability and fuel strategy before 2027.
Singapore sold 584,300 more tonnes of conventional marine fuel and bio-blends in October than in September. But nearly all of that growth came from conventional oil. High-sulphur fuel hit a record, while bio-blended volumes fell by 29,000 tonnes. Shipowners face two different buying markets: deep, busy conventional supply and a much thinner market for certified alternatives.
The actual October fuel ledger
MPA / preliminary metric tonnesThese categories are mutually exclusive. Bio-blended bunker volume includes the fossil portion of each blend; it is not pure biofuel tonnage.
| Fuel category | September '26 | October '26 | Oct. share* | Month change | Commercial interpretation |
|---|---|---|---|---|---|
| Conventional low-sulphur fuel oil | ~2,218,600 t | 2,583,160 t | 49.1% | +16.4% | Biggest absolute monthly lift; largest buying category |
| Conventional high-sulphur fuel oil | ~1,993,200 t | 2,200,760 t | 41.8% | +10.4% | Record demand from vessels able to burn HSFO legally |
| Conventional distillates, MGO + LSMGO | ~379,900 t | 421,580 t | 8.0% | +10.9% | Fuel specification and sulphur compliance still drive buying |
| Bio-blended low-sulphur and marine fuel oil | ~83,200 t | 54,160 t | 1.0% | −34.9% | 49,980 t low-sulphur blend; 4,180 t high-sulphur blend |
| Conventional + bio-blends | ~4,675,400 t | 5,259,660 t | 100% | +12.5% | 5.26M-tonne headline denominator |
| LNG | ~51,500 t | 50,010 t | Separate | −2.9% | Third monthly decline, but not a fleet-demand forecast |
| Ethanol | 0 t recorded | 5,250 t | Separate | New category | Following Singapore's first large-scale ethanol bunkering |
| All listed fuels | ~4,726,900 t | 5,314,920 t | Wider total | ~+12.4% | Conventional, bio-blends, LNG and ethanol combined |
* Market shares use 5,259,660 tonnes, excluding LNG and ethanol. September figures are rounded comparable category totals. The October dataset remains preliminary and subject to revision.
Six signals that change the buying decision
Volumes / price / exposureMore ships, barely larger fuel stems
October bunker calls rose from about 3,617 to 4,008. Average conventional-plus-bio stem size was approximately 1,312 tonnes against 1,293 in September, just 1.5% higher. The 12.5% fuel-volume gain was principally a traffic story.
More simultaneous requirements can tighten barge slots even when each ship buys roughly the same amount. The data do not prove October queues grew, but they justify testing supplier capacity.
High-sulphur bunker demand is still enormous
HSFO accounted for 41.8% of conventional-plus-bio sales, growing 10.4% month on month and 17.9% against October 2025. That is material physical demand, not merely interest in scrubber technology.
But sales do not reveal each ship's net profit from a scrubber. Additional power, maintenance, washwater limitations, finance and the delivered HSFO–VLSFO spread decide the result.
The largest category also became markedly more expensive
Conventional low-sulphur fuel oil rose to 2.583 million tonnes, a 16.4% monthly increase. Its gain accounted for roughly 62% of the net conventional-plus-bio volume increase.
Singapore's October average VLSFO assessment was about $929/t versus $870/t in September. On a 1,200-tonne stem, the $59/t difference adds $70,800 before any change in consumption.
Bio-blend sales fell while fossil volumes surged
Bio-blended bunker sales dropped to 54,160 tonnes, down about 29,000 tonnes from September and 13.8% on October 2025. January–October biofuel sales totalled around 625,000 tonnes versus roughly 1.20 million a year earlier.
These are delivered blend tonnes, not neat biogenic tonnes. A B30 delivery includes about 70% conventional base fuel by volume, depending on specification. Certification and verified lifecycle intensity determine compliance value.
A new fuel entered the ledger while LNG weakened
October LNG bunkering fell to about 50,010 tonnes, down 2.9% monthly and 17.5% yearly. Methanol sales were not recorded in October. Yet the updated MPA dataset also lists 5,250 tonnes of ethanol, following an approximately 5,000-tonne bioethanol delivery to Maersk Halifax on October 17.
That first large operation is evidence of capability, not yet evidence of a recurring commodity market. Project development, delivered fuel volumes and fleet ordering proceed on different schedules.
One exceptional month is not the annual trend
Conventional and bio-blended bunker sales rose 10.6% from October 2025, while January–October sales increased only 2.7% to 47.23 million tonnes. October was the strongest month of 2026 so far, not an all-time annual demand forecast.
Singapore's electronic bunker delivery note is the default since April 2025, with verification available through digitalPORT@SG. Procurement analytics can now connect supply invoices, mass-flow quantity and actual onboard fuel reconciliation more closely.
Which supply constraint hurts the owner first?
Decision ladderA nominally cheaper bunker is worthless if the vessel cannot receive it within its operating window.
Check ISO 8217 specification, engine limits, sulphur regime and fuel changeover requirements.
Price fuel, equipment energy, waiting, diversion and commercial recovery together.
Use e-BDN, mass-flow data, product certificates and sampling to preserve quantity and quality claims.
Price move on one stem
1,200 tonnes at a $59/t October-versus-September VLSFO increase.
Price concession example
A $20/t discount saves $24,000 on 1,200 tonnes before diversion.
Deviation can erase it
A hypothetical $35,000 extra voyage cost makes that discounted port $11,000 more expensive.
2027 BUNKER PROCUREMENT / LIVE FLEET STRESS TEST
Compare VLSFO, HSFO with a scrubber, a selected bio-blended programme and a competing bunkering port on the same fuel-equivalent demand. Test the delivered spread, capital recovery, delay days and documented compliance-credit sensitivity. Prices other than the cited historical VLSFO average are editable assumptions, not current offers.
Annual fuel procurement budget
Cells show annual net scrubber benefit. Click any result to load that spread and extra fuel-use percentage into the calculator.
| Metric | Basis | Result |
|---|
We welcome your feedback, suggestions, corrections, and ideas for enhancements.
Please click here to get in touch