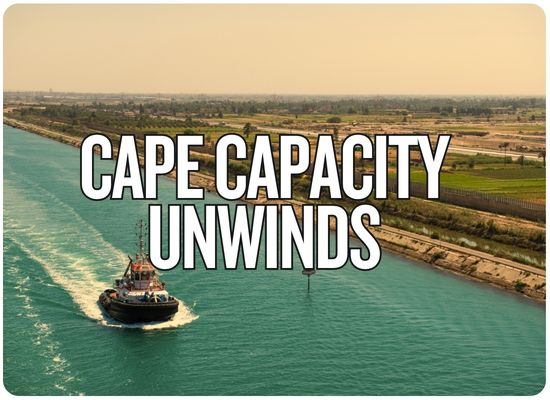
Large containership traffic through the Suez Canal accelerated sharply during the third quarter of 2026 as major carriers continued restoring services that had been diverted around the Cape of Good Hope. The Suez Canal Authority says 166 containerships above 130,000 net tons transited between July and September, compared with just 16 in Q3 2025. Their combined Suez Canal net tonnage increased from 2.4 million to 29 million tons. That is more than a tenfold increase in qualifying vessel transits and a twelvefold increase in tonnage. The return is still incomplete, but it is becoming large enough to affect voyage lengths, vessel availability and the container market's supply-demand balance.
Suez Container Recovery · Q3 2026
One Year Changed the Scale of the Ships Coming Back
The Canal's recovery is increasingly being driven by vessels above 130,000 net tons, the ships whose return matters most for Asia-Europe network capacity.
Q3 2025
16
large qualifying containership transits
Combined Net Tonnage
2.4M tons
Average approximately 150,000 Suez Canal net tons per qualifying vessel.
→
12 months later
Q3 2026
166
large qualifying containership transits
Combined Net Tonnage
29.0M tons
Average approximately 174,700 Suez Canal net tons per qualifying vessel.
Transit Count
10.4×
Q3 qualifying containership crossings versus the same quarter of 2025.
Net Tonnage
12.1×
The tonnage increase ran even faster than the vessel-count recovery.
Average Qualifying Ship
+16.5%
Derived increase in average net tonnage among the reported large-vessel transits.
Size Threshold
>130K
Suez Canal net tons required for inclusion in the Authority's Q3 comparison.
October 13 Milestone
CMA CGM PANTHEON
The new mega-containership made its first Suez Canal transit on the same day the Authority published the Q3 figures.
Canal Net Tonnage
221,000 tons
One of the very large vessels now returning to the route.
Voyage
Morocco → Malaysia
The ship crossed with the Canal's northbound convoy.
Carrier Return Board · October 2026
Suez Is No Longer a CMA CGM-Only Story
The largest alliances are now restoring selected services at different speeds. The pattern remains cautious and reversible, but the number of major-network sailings using the Canal is expanding.
CMA CGM
Established Return
The SCA says CMA CGM continues restoring services through Suez as a permanent and sustainable route. Sixty group vessels crossed during September.
Leading large-vessel return
Maersk + Hapag-Lloyd
Expanding
Gemini services have progressively shifted from Cape routing to the Red Sea, including AE15 and several additional Asia-Europe services during September.
Service-by-service normalization
MSC
Partial
MSC began restoring selected East-West services in August and added further routings in September while keeping contingency plans for renewed Cape diversions.
Selected directions only
COSCO / OOCL
Expanding
OOCL Portugal marked a major September return and additional COSCO/OOCL sailings have followed through the Canal.
24,000-TEU class returning
ONE / HMM / Yang Ming
Next Wave
Premier Alliance has scheduled FE1 and IOX/INX Asia-North Europe services back through Suez beginning with autumn sailings.
Cape rotations shorten
Sea-Intelligence · September
27%
Average Red Sea/Suez normalization across Asia-Europe capacity during September. The percentage measures routed vessel capacity, not total Canal traffic.
Asia → Europe headhaul range13%–25%
Europe → Asia backhaul range25%–47%
Returned Since May
140+ Ships
Linerlytica estimate of containerships shifted back toward Suez routing.
Nominal Capacity
>2M TEU
Combined nominal capacity represented by those returning vessels.
Recent Weekly Peak
30 Ships
Ships above 4,000 TEU crossing in one week, the strongest level since 2024.
Global Orderbook
15.6M TEU
Linerlytica's current containership newbuilding pipeline across 1,925 ships.
Premier FE1 · Cape
13 Weeks
Previous round-voyage structure while the service routed around Africa.
→
Premier FE1 · Suez
11 Weeks
Revised service cycle reported for the Suez routing.
=
Weekly Loop Effect
~2 Ships
Illustrative vessel requirement released by shortening a weekly 13-week loop to 11 weeks.
This is not yet full normalization.
Carriers continue to make service-specific security assessments, and several still retain Cape routings or asymmetric eastbound/westbound patterns. Individual services can revert quickly if Red Sea conditions deteriorate.
Ship Universe Suez Capacity Release Tool
How Many Ships Does a Shorter Suez Rotation Release?
Model the fleet effect when weekly liner services move from longer Cape of Good Hope rotations back through Suez.
services
sailings/wk
weeks
weeks
TEU
M TEU
M TEU
%
Allows for some vessels to be absorbed by slower steaming, maintenance, schedule recovery or other operational uses.
Vessel Slots Released
20
fewer vessels theoretically required to maintain the entered weekly loops
Nominal Capacity Released
280K
vessel slots multiplied by average entered vessel capacity
Effective Redeployable Capacity
224K
released nominal TEU adjusted by the entered redeployment share
Round-Trip Time Saved
14 days
difference between the entered Cape and Suez service cycles
Share of Global Fleet Released
0.81%
nominal released capacity relative to the entered global fleet
Orderbook Equivalent
1.8%
released nominal capacity compared with today's entered newbuilding orderbook
Vessel Requirement Per Weekly Service
A weekly loop normally requires approximately one ship for every week in its full round-voyage cycle. Shortening the rotation can therefore remove entire vessel positions from the schedule.
Cape Requirement13 ships/service
Suez Requirement11 ships/service
Global Newbuilding Orderbook15.6M TEU
Selected Scenario
FE1-Style Return
Released ships do not automatically become idle. Carriers can redeploy them onto other trades, add frequency, restore schedules, slow-steam, phase out older vessels or use the capacity to compete for market share.
Services10
Cape Cycle13 wk
Suez Cycle11 wk
Avg Ship14K TEU
Model limitation:
This is a fleet-planning illustration, not a forecast of actual carrier capacity. Weekly liner services can include additional buffer ships, blank sailings, slow steaming, port omissions and schedule-recovery vessels. Nominal TEU released from a service does not mean that the same amount immediately appears as commercial spot capacity.
Feedback Welcome
We welcome your feedback, suggestions, corrections, and ideas for enhancements.