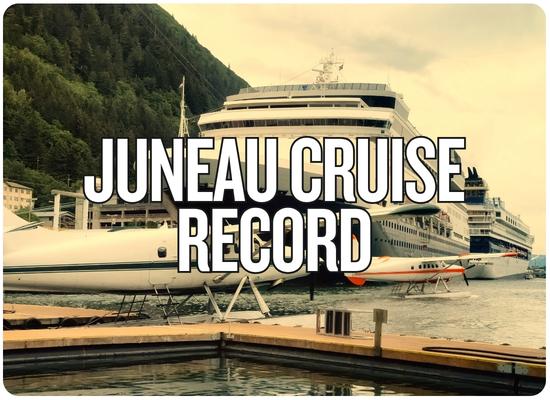
Juneau closed its 2026 cruise season with 1,733,016 passengers, the highest annual total in the Alaska capital’s history, even as the city implemented its first daily cruise-capacity limits. The final count was about 2.6% above 2025’s 1,688,738 passengers, with ships sailing at an unusually high 104% of scheduled lower-berth capacity. That distinction helps explain the apparent contradiction: Juneau’s new agreement limits scheduled lower berths to 16,000 Sunday through Friday and 12,000 on Saturdays, not the exact number of people who ultimately sail. Ships can carry more than two occupants per cabin using bunks, sofa beds and other berths. City officials say the goal is to prevent another period of rapid growth and reduce peak-day impacts rather than force annual passenger totals downward.
Juneau Cruise Season · 2026
A Record Year in the First Season of Daily Limits
Juneau's experiment shows why cruise-cap policy is more complicated
than a single annual passenger number. Scheduled capacity was constrained,
but extremely full ships still produced the city's largest passenger season.
2026 Final Passenger Count1,733,016cruise passengers
The largest annual cruise total recorded in Juneau.
The final ship of the season, Norwegian Encore, departed October 6.
Growth vs. 2025+2.6%
2025 finished at 1,688,738 passengers.
Ship Occupancy104%
Final passengers relative to scheduled lower-berth capacity.
Regular Daily Limit16,000
Scheduled lower berths Sunday through Friday.
Saturday Limit12,000
Lower Saturday ceiling intended to create a lighter day for the community.
Passenger Growth Has Flattened, But at a Record Level
20231,638,902
Post-pandemic cruise growth accelerated sharply.
20241,677,935
Another high-volume Alaska season.
20251,688,738
Growth slowed substantially.
20261,733,016
New record despite the first season of lower-berth limits.
The Hidden Driver: Ships Were Extremely Full
Lower-berth capacity assumes two passengers per cabin. Actual ships can carry
third and fourth occupants in additional berths, which is why actual passenger
volumes can exceed 100% of lower-berth capacity.
April99%
May101%
June106%
July109%
August105%
September99%
What the Agreement CapsLower Berths
The agreement manages scheduled cruise capacity. It is not a turnstile
counting the precise number of passengers stepping ashore.
What Juneau Says It WantsStability
City officials say the objective is to prevent explosive future growth
and reduce peak-day impacts while maintaining a large visitor economy.
The annual record does not mean the daily-limit policy failed.
The city's agreement was designed around daily scheduled capacity and peak impacts,
not an annual numerical ceiling. Juneau officials currently expect passenger
volumes to remain relatively flat through 2027 and 2028.
Juneau's Cruise Tradeoff
The Same 1.7 Million Visitors Create Revenue and Capacity Pressure
Juneau's debate is not neatly divided between a tourism economy and an anti-tourism community.
City research shows substantial economic dependence alongside persistent resident concerns
about crowding, traffic and pressure on public spaces.
Economic Exposure
Latest comprehensive CBJ economic-impact study is based on the 2023 cruise season.
Direct Cruise Spending · 2023$375M
Passenger, crew and cruise-line spending combined.
Passenger Spending$320M
The largest component of the industry's direct local spending.
Employment Impact3,850 Jobs
Direct plus indirect employment associated with cruise activity in the 2023 study.
Cruise-Related Sales Tax$18M
Equivalent to 26% of CBJ sales-tax collections in the study year.
Resident Pressure
CBJ's 2025 resident survey was conducted among 520 randomly selected Juneau residents.
City Not Doing Enough53%
Share saying CBJ was not doing enough to manage visitor-industry impacts.
Downtown Sidewalk Crowding70%
Residents saying their household was somewhat or very affected.
Mendenhall Crowding66%
One of the most persistent visitor-impact concerns in the survey.
Downtown Traffic59%
Residents reporting some or significant effect from vehicle congestion.
Current Passenger Charges
$13 / Visit
Cruise passengers currently contribute a combined $13 per visit through
Juneau's passenger-fee structure. The proceeds are restricted to visitor-related
infrastructure, services and impact mitigation.
FY27 Draft Allocation$24.49M
Proposed operating, grant and capital expenditures supported by passenger fees.
2023 CBJ Fees$22M
Cruise-related fees and payments identified in the economic-impact study.
Average Visitor Spend · 2023$232
Historical study average across tours, retail, dining and transportation.
Tour + Retail Share79%
Tours/activities and retail represented most direct cruise spending in the study.
What Residents Said Should Receive Priority
Five-Ship Limit60%
Share assigning this a high priority in the 2025 survey.
Tour Impacts58%
High priority for managing tour impacts on residents.
Passenger Cap56%
High priority for maintaining the daily passenger-cap framework.
The economic figures are not 2026 estimates.
They come from CBJ's latest comprehensive cruise economic-impact study, based on 2023.
They are useful for showing the scale and structure of Juneau's exposure, but 2026
visitor spending and employment should not be assumed to be identical.
Ship Universe Destination Capacity Tool
Juneau Cruise Volume & Local-Economy Scenario
Test how lower-berth capacity and ship occupancy translate into actual passenger
volume, passenger-fee proceeds and a historical spending proxy.
berths
Illustrative starting value derived from the 2026 passenger total at 104% occupancy.
%
passengers
Default is Juneau's final 2026 record.
$/passenger
$/person
Based on CBJ's 2023 study. Use only as a historical scenario reference.
points
Reduces the entered occupancy rate for a second scenario.
Difference vs Comparison0
modeled passenger volume minus comparison volume
Reduced-Occupancy Scenario1.73M
passenger volume after entered occupancy reduction
Passenger Change0
difference between base and reduced-occupancy scenarios
Volume Comparison
Because Juneau regulates lower-berth capacity rather than exact bodies ashore,
occupancy can materially change the final seasonal passenger count.
2026 Comparison
1.73M
Modeled Scenario
1.73M
Capacity Interpretation
Capacity ≠ Passengers
Ships operating above lower-berth capacity can produce a record passenger
season even when the schedule itself is constrained.
Lower Berths1.67M
Occupancy104%
Fee$13
Spend Ref.$232
Scenario model only:
the $232 spending input comes from Juneau's 2023 economic-impact study and
should not be treated as a measured 2026 average. The $13 passenger-fee input
represents Juneau's current combined per-visit fee structure, but actual fiscal
collections and allowable expenditures are governed by specific city and state rules.
Lower-berth capacity is also not the same as actual persons disembarking.
Feedback Welcome
We welcome your feedback, suggestions, corrections, and ideas for enhancements.