
SHIPUNIVERSE
Maritime Intelligence, Tools & Live Industry Radars

One place for live maritime intelligence, practical decision tools, industry events and focused reporting.

RADARS
TOOLS
All Tools
Latest 20
Open to load latest items…
NEWS
All News
Latest 20
Open to load latest items…
REPORTS
All Reports
Latest 20
Open to load latest items…
TECH
All Tech
Latest 20
Open to load latest items…
CRUISE
All Cruise
Latest 20
Open to load latest items…
NAVAL
All Naval
Latest 20
Open to load latest items…
SHIPUNIVERSE REPORTING

Reports, news and industry coverage

Full analysis in the ShipUniverse intelligence layout.

← Back to latest posts ShipUniverse / NEWS

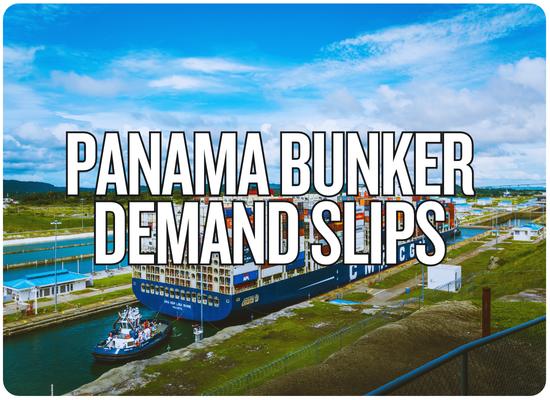
Panama Bunker Sales Fall 6.8% Despite Steady Canal Traffic

🔔 Subscribe to ShipUniverse Weekly →

Panama Canal Bunkering Market Pacific: Balboa area | Atlantic: Colón / Cristóbal area

Panama Maritime Authority bunker statistics published in November show that marine fuel sales fell to 430,380 metric tonnes in October 2026, compared with 461,719 tonnes in October 2025, a decrease of 6.8%. Pacific-side sales declined from 378,485 to 346,931 tonnes, while Atlantic-side sales moved from 83,234 to 83,449 tonnes. The number of vessels calling for bunkers decreased from 643 to 581 year over year. The preliminary figures were reported by maritime fuel market publications on November 18 and 19, 2026.

ShipUniverse | Marine Fuel Market Intelligence

Fewer Bunker Calls, Not Fewer Canal Transits

Panama's October fuel sales fell 6.8% year over year, but official canal transit figures were virtually flat. The weakness was concentrated on the Pacific side and in very-low-sulfur fuel oil.

October Fuel Sales 430,380 t

Down 6.8% year over year

Bunkering Vessel Calls 581

Down 9.6% year over year

Canal Transits 1,029

Versus 1,028 in October 2025

September to October +11.7%

Monthly bunker-sales rebound

The Pacific Accounted for the Entire Net Decline

October sales by coast, in metric tonnes. Year-on-year changes calculated from the latest reported comparable figures.

MarketOct 2025Oct 2026Volume ChangeYoY
Pacific Coast378,485346,931-31,554 t-8.3%
Atlantic Coast83,23483,449+215 t+0.3%
Panama Total461,719430,380-31,339 t-6.8%
100.7% of the national net decline originated on the Pacific side. Its 31,554-tonne contraction exceeded Panama's overall loss because Atlantic sales rose slightly, offsetting 215 tonnes.
The Fuel Mix Is Changing Too

National sales by product, metric tonnes. VLSFO remains dominant, while RMG 380 gained share.

Fuel GradeOct 2025Oct 2026YoY Change
VLSFO327,581280,131-14.5%
RMG 380 / HSFO83,386105,775+26.9%
LSMGO46,06037,185-19.3%
MGO3,0927,289+135.7%
Bio-blended Fuel1,6000-1,600 t
Total461,719430,380-6.8%

RMG 380 gained market share: from approximately 18.1% to 24.6%. Its 22,389-tonne increase partly offset a 47,450-tonne drop in VLSFO. The data establish a shift in purchases, not whether price, scrubber-equipped vessels or changing trade patterns caused it.

The Most Revealing Comparison
Canal Transits 1,028 → 1,029

Essentially unchanged in October year over year.

Bunker Calls 643 → 581

62 fewer vessels supplied, a 9.6% decline.

Average Fuel per Call 718 → 741 t

Approximate 3.2% increase in average delivery size.

The decline was concentrated in the number of bunker-supply calls rather than smaller average deliveries. Canal transits remained stable, so weaker canal traffic alone cannot explain October's sales decline.

The two counts represent different activities: canal transits are recorded by the Panama Canal Authority, while bunker calls are recorded by the Maritime Authority. They are not a matched vessel population, and the figures do not establish what percentage of transiting vessels bought fuel.

A Weak October, Not a Collapsing Year
January–October 2026 4.36M t

Approximately 0.4% below the same ten months of 2025.

October vs September +11.7%

October reached a six-month sales high, despite its negative year-on-year comparison.

For bunker suppliers, the immediate signal is narrower Pacific-side demand and a changing product mix. For shipowners, Panama's competitiveness still depends on delivered fuel prices, grade availability, supply windows and total voyage economics. The sales figures alone cannot establish whether more ships refueled elsewhere or changed their purchasing patterns.

Data note: Preliminary bunker figures are subject to revision. The October 2025 comparatives used here are the updated figures reported alongside the October 2026 release; earlier preliminary 2025 tables differ slightly.

Panama's October bunker market lost 31,339 tonnes of sales year over year, driven entirely by the Pacific coast. Fewer bunker calls and weaker VLSFO purchases accompanied virtually unchanged canal transit numbers. With sales recovering from September and the ten-month total only slightly lower, the next data releases will show whether October was a temporary purchasing shift or a more persistent change in Panama's marine fuel market.

Feedback Welcome

We welcome your feedback, suggestions, corrections, and ideas for enhancements.

Please click here to get in touch
By the ShipUniverse Editorial Team — About Us | Contact


← Browse more ShipUniverse posts
MARITIME DECISION TOOLS

Practical tools for real vessel and commercial decisions

Browse the latest 24 tools or instantly search every published ShipUniverse maritime tool.

24 latest toolsView all 325 →
TOOL

PCTC Vehicle Cargo Mix, Deck Capacity, Port Rotation & Voyage Profitability Tool

🔔 Subscribe to ShipUniverse Weekly → SHIPUNIVERSE / VEHICLE CARRIER COMMERCIAL…

Open →
TOOL

Shipyard Change Orders, Scope Growth, Subcontractor Claims & Newbuild Cost Recovery Tool

🔔 Subscribe to ShipUniverse Weekly → SHIPUNIVERSE / NEWBUILD COMMERCIAL CONTROL…

Open →
TOOL

Alternative Fuel Bunkering Network, Port Availability, Fuel Supply Contracts & Voyage Deviation Economics Tool

🔔 Subscribe to ShipUniverse Weekly → SHIPUNIVERSE / MARINE FUEL &…

Open →
TOOL

Maritime Cloud Service Outage, Backup Communications, Fleet Downtime & Business Continuity ROI Tool

🔔 Subscribe to ShipUniverse Weekly → SHIPUNIVERSE / FLEET DIGITAL RESILIENCE…

Open →
TOOL

Bulk Terminal Stockpile, Conveyor & Shiploader Capacity, Vessel Queues & Demurrage Cost Tool

🔔 Subscribe to ShipUniverse Weekly → SHIPUNIVERSE / BULK TERMINAL COMMERCIAL…

Open →
TOOL

Offshore Cable-Laying Vessel Fleet, Installation Scheduling, Weather Downtime & Project Delay Cost Tool

🔔 Subscribe to ShipUniverse Weekly → SHIPUNIVERSE / OFFSHORE CONSTRUCTION ECONOMICS…

Open →
TOOL

Port Electric RTG & Terminal Tractor Fleet, Charging Infrastructure, Grid Capacity & ROI Tool

🔔 Subscribe to ShipUniverse Weekly → SHIPUNIVERSE / TERMINAL ELECTRIFICATION INTELLIGENCE…

Open →
TOOL

Cruise Private Island Investment, Berth Capacity, Guest Spending & Destination Profitability Tool

🔔 Subscribe to ShipUniverse Weekly → SHIPUNIVERSE / CRUISE DESTINATION INVESTMENT…

Open →
TOOL

FSRU Regasification Capacity, LNG Send-Out, Gas Offtake Contracts & Conversion ROI Tool

🔔 Subscribe to ShipUniverse Weekly → SHIPUNIVERSE / FLOATING LNG REGASIFICATION…

Open →
TOOL

Offshore CO₂ Shipping Supply Chain, LCO₂ Carrier Fleet Sizing, Terminal Slots & Transport Economics Tool

🔔 Subscribe to ShipUniverse Weekly → SHIPUNIVERSE / OFFSHORE CARBON TRANSPORT…

Open →
TOOL

Shipyard Production Capacity, Critical Supplier Bottlenecks, Workforce Allocation & Newbuild Delay Cost Tool

🔔 Subscribe to ShipUniverse Weekly → SHIPUNIVERSE / SHIPBUILDING OPERATIONS &…

Open →
TOOL

Cruise Shore Excursion Capacity, Tour Operator Revenue Share, Cancellation Risk & Port-Day Profitability Tool

🔔 Subscribe to ShipUniverse Weekly → SHIPUNIVERSE / CRUISE & DESTINATION…

Open →
TOOL

Maritime GNSS Jamming & Spoofing, Backup Navigation Readiness, Voyage Delay & Retrofit ROI Tool

🔔 Subscribe to ShipUniverse Weekly → SHIPUNIVERSE / BRIDGE RESILIENCE &…

Open →
TOOL

Fleet Vessel Deployment, Ballast Positioning, Charter Opportunities & TCE Optimization Tool

🔔 Subscribe to ShipUniverse Weekly → SHIPUNIVERSE / COMMERCIAL FLEET DECISION…

Open →
TOOL

Port Terminal Operating System Upgrade, Automation Tender, Operational Downtime & CAPEX ROI Tool

🔔 Subscribe to ShipUniverse Weekly → SHIPUNIVERSE / PORT SYSTEMS &…

Open →
TOOL

Floating LNG Storage Unit Investment, Bunkering Slots, Open-Access Fees & Charter ROI Tool

🔔 Subscribe to ShipUniverse Weekly → SHIPUNIVERSE / LNG INFRASTRUCTURE &…

Open →
TOOL

Panama Canal Transit Slot Auction, Waiting Time, Draft Restrictions & Route Diversion Economics Tool

🔔 Subscribe to ShipUniverse Weekly → ShipUniverse / Canal Access &…

Open →
TOOL

Offshore Wind O&M Vessel Fleet, CTV/SOV Scheduling, Technician Transfers & Turbine Downtime Cost Tool

🔔 Subscribe to ShipUniverse Weekly → ShipUniverse / offshore wind operations…

Open →
TOOL

Vessel Sale & Purchase Closing, Escrow, Bunker ROB, Delivery Documents & Cash Settlement Tool

🔔 Subscribe to ShipUniverse Weekly → SHIPUNIVERSE / VESSEL TRANSACTION INTELLIGENCE…

Open →
TOOL

Harbor Tug Fleet Contract Tender, Utilization, Standby Fees & Towage Profitability Tool

🔔 Subscribe to ShipUniverse Weekly → SHIPUNIVERSE / PORT & TOWAGE…

Open →
TOOL

Marine General Average, Cargo Contribution, Security Deposits & Claims Settlement Exposure Tool

🔔 Subscribe to ShipUniverse Weekly → SHIPUNIVERSE / MARITIME CLAIMS &…

Open →
TOOL

Chemical Tanker Cargo Parcel Allocation, Tank Compatibility, Cleaning Turnaround & Voyage Margin Tool

🔔 Subscribe to ShipUniverse Weekly → SHIP UNIVERSE / CHEMICAL TANKER…

Open →
TOOL

Marine Insurance Claims Portfolio, Hull & P&I Loss Runs, Reserves & Renewal Negotiation Tool

🔔 Subscribe to ShipUniverse Weekly → SHIPUNIVERSE / FLEET INSURANCE &…

Open →
TOOL

Offshore Platform Decommissioning, Vessel Spread, Weather Windows & Removal Campaign Cost Tool

🔔 Subscribe to ShipUniverse Weekly → SHIPUNIVERSE / OFFSHORE ASSET RETIREMENT…

Open →