
SHIPUNIVERSE
Maritime Intelligence, Tools & Live Industry Radars

One place for live maritime intelligence, practical decision tools, industry events and focused reporting.

RADARS
TOOLS
All Tools
Latest 20
Open to load latest items…
NEWS
All News
Latest 20
Open to load latest items…
REPORTS
All Reports
Latest 20
Open to load latest items…
TECH
All Tech
Latest 20
Open to load latest items…
CRUISE
All Cruise
Latest 20
Open to load latest items…
NAVAL
All Naval
Latest 20
Open to load latest items…
SHIPUNIVERSE REPORTING

Reports, news and industry coverage

Full analysis in the ShipUniverse intelligence layout.

← Back to latest posts ShipUniverse / NEWS

China Drives 65% of Global Dry-Bulk Growth as Cement and Clinker Reshape Shipping Demand

🔔 Subscribe to ShipUniverse Weekly →

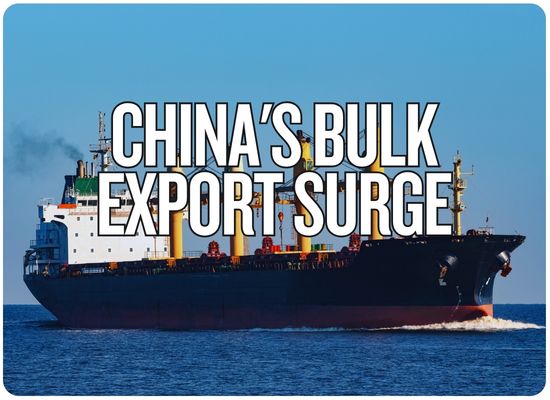
China's dry-bulk cargo loadings reached 274.9 million metric tonnes during the first ten months of 2026, an increase of 14.9% from the same period last year, according to new analysis released November 17 by Ursa Shipbrokers using Signal Ocean vessel-tracking data. The country contributed 35.6 million tonnes of the worldwide 54.4-million-tonne increase in dry-bulk loadings, equivalent to 65.4% of global growth. Worldwide loadings rose 1.1% to approximately 4.96 billion tonnes, while Chinese loadings reached their highest January–October level in the research series dating to 2014. The analysis follows a multiyear increase in Chinese outward dry-bulk movements and identifies the country as a growing source of seaborne cargoes.

Geographic coverage: China, including its maritime loading ports. The reported figures are nationwide vessel-tracking aggregates, not movements through any one Chinese port. The map provides geographic context rather than verified locations of individual export cargoes.
274.9MTonnes loaded in China, January–October 2026
+14.9%Increase against the corresponding 2025 period
65.4%China's contribution to worldwide loading growth
ShipUniverse | Dry-Bulk Market Intelligence | November 17, 2026

65% of the World's New Dry-Bulk Tonnage Came From China

Chinese loading volumes increased far faster than the global market, even though China still accounts for a comparatively small share of total worldwide dry-bulk cargo origins.

274.9MChina cargo loadings, Jan–Oct
+35.6MTonnes above Jan–Oct 2025
+14.9%Chinese loading growth
5.5%Share of global loading volume

Who Generated the Extra 54.4 Million Tonnes?

Contribution to the net worldwide increase in tracked dry-bulk loading volumes, January–October 2026 versus the corresponding 2025 period.

65.4%China's share of
global growth
China+35.6M tonnes
All Other Origins Combined+18.8M tonnes

The 18.8-million-tonne figure is calculated by ShipUniverse as the difference between Ursa's global and Chinese net increases.

The Smaller Number That Makes This Important

China has become disproportionately important to new cargo formation, but it has not become the world's largest dry-bulk loading origin. The difference between its share of all cargo and its share of new cargo is central to the story.

China's Share of All Dry-Bulk Loadings 5.5%

Share of the approximately 4.96 billion tonnes loaded worldwide during the first ten months of 2026.

China's Share of Additional Loadings 65.4%

Share of worldwide year-over-year growth contributed by China during the same period.

China's Global Market Share Keeps Rising

Share of worldwide vessel-tracked dry-bulk loadings for the same January–October comparison window in each year.

20202.5%Global loading share
20233.7%Global loading share
20254.9%Global loading share
20265.5%Global loading share

Annual Chinese Loadings More Than Doubled Since 2020

Full-calendar-year loading totals from Ursa's historical series. The January–October 2026 figure is deliberately excluded from these annual bars.

2020
128.6M
2022
187.5M
2023
207.1M
2024
249.6M
2025
291.5M
September 2026 Monthly Record 32.8M tonnes

Highest monthly Chinese dry-bulk loading figure identified in the Ursa series.

October 2026 Loadings 29.5M tonnes

Up 12.8% from October 2025, though lower than the September record.

China Versus the Global Market

The following table keeps worldwide loading growth, China's annualized history and its latest ten-month sample in their appropriate periods.

↔ Top and bottom horizontal scrollbars move together.
IndicatorJanuary–October 2026Year-over-Year ChangeWhat the Figure Means
China Dry-Bulk Loadings274.9 million tonnes+35.6 million | +14.9%Tracked cargo loadings originating at Chinese ports, compared with about 239.2 million tonnes in the comparable 2025 period.
Global Dry-Bulk LoadingsApproximately 4.96 billion tonnes+54.4 million | +1.1%All tracked loading origins worldwide in Ursa's dataset.
Origins Outside ChinaAbout 94.5% of world loadings+18.8 million | about +0.4%Combined non-China growth calculated from Ursa's net tonnage totals. It does not mean every other exporting country grew.
Chinese Contribution to Global Growth65.4%Contribution measureChina supplied approximately two-thirds of the net new dry-bulk loading volume.
China Full-Year 2025291.5 million tonnes in calendar 2025Historical annual referenceA full-year total. It should not be directly compared with ten months of 2026 to calculate a growth percentage.
NoteThese are broker-reported vessel-tracking estimates of loaded dry-bulk cargoes, not China's total merchandise exports, container export figures or a customs-based cargo census. Tonnage alone does not measure voyage length, vessel earnings or net tonne-mile demand.
The ShipUniverse finding: The rest of the world collectively added just 18.8 million tonnes of dry-bulk loadings, while Chinese ports added 35.6 million tonnes. That is a major shift in where new cargo originates. The next question is which of those cargoes travel far enough, and require enough vessel time, to materially change the supply-demand balance for dry-bulk ships.
Data boundary: Figures from Ursa/Signal Ocean describe one vessel-tracking dataset and should not be automatically combined with BRS/AXSMarine, customs or port-authority totals. The 65.4% figure measures China's contribution to growth, not its share of all global dry-bulk exports or its share of total shipping revenue.
ShipUniverse | Vessel Demand and Commodity Trade

Clinker Is Creating Vessel Demand While Geared Bulkers Find New Export Cargoes

Separate shipbroker and trade datasets show that outbound industrial cargoes can support smaller dry-bulk vessels even as Chinese demand for some inbound commodities weakens.

The Bigger Freight Metric Is Tonne-Miles

IFCHOR GALBRAITHS research covering Chinese clinker exports aboard Supramax and Ultramax vessels during January–October 2026.

Additional Chinese Clinker Tonne-Miles 54.4 Billion Additional tonne-miles, up 206% year over year in the broker's tracked Supramax/Ultramax clinker trade.
Contribution to Total Supramax Tonne-Mile Growth 28% Chinese clinker export voyages alone accounted for more than a quarter of the segment's overall tonne-mile increase in the broker's study.
The same research attributes nearly 90% of global clinker tonne-mile growth to Chinese exports in the tracked vessel segment. Tonne-miles measure cargo multiplied by distance, not cargo tonnage alone.

The Leading Export Growth Categories Are Not What Many Expect

BRS Shipbrokers' AXSMarine-based analysis of January–September 2026 found that cement and clinker together added more Chinese export cargo tonnes than the broader steel category.

Cement + Clinker | Additional Export Cargo +9.6M tonnes
Combined growth in cement and clinker cargoes in the BRS January–September loading sample.
Broader Steel Category | Additional Cargo +6.9M tonnes
Steel-related cargo growth in the same BRS period and dataset. The category is not necessarily identical to customs-defined finished steel.
Important distinction: China's General Administration of Customs reported 95.495 million tonnes of finished-steel product exports during January–October, down 2.3% year over year. BRS, by contrast, measured growth in its broader seaborne steels category over January–September. The periods, commodity definitions and measurement methods differ. Neither series should be substituted for the other.

Geared Bulkers Are Gaining Cargo in Both Directions Combined

In BRS's January–September data, cargo shipped out of China on geared bulk carriers of roughly 25,000–68,000 DWT increased more than inbound cargoes declined.

Chinese Outbound Geared Cargo +25.1M Additional tonnes loaded in China on geared bulkers.
Chinese Inbound Geared Cargo −11.2M Reduction in tonnes discharged in China on that vessel segment.
Combined Two-Way Change +13.9M Net additional tonnes across the two directions, calculated from BRS's figures.
Why this changes positioning: A geared ship arriving in China with an import cargo may have a wider choice of subsequent outbound employment than in earlier years. That can create opportunities to reduce ballast sailing. But the published aggregate figures do not prove that the same ships captured both import and export cargoes, or that ballast distances have already fallen for the fleet as a whole.

Three Cargo Chains Are Developing Differently

Chinese Limestone Exports | Customs Data 13.6M tonnes

S&P Global's analysis of trade data recorded about 13.6 million tonnes of Chinese limestone exports during January–August 2026, up approximately 2,298% year over year. India received 10.07 million tonnes, nearly 74% of the recorded volume.

Chinese Limestone | Seaborne Tracking 5.49M tonnes

Ursa's separate vessel-tracking study identified 5.49 million tonnes of international seaborne limestone exports during January–August, compared with roughly 110,000 tonnes a year earlier. Its coverage differs from customs records.

What changed the limestone market: S&P Global identifies disruption to Persian Gulf supply as one reason buyers sought Chinese material. It reported that UAE limestone exports fell 45.8% and Oman's fell 9.37% during the same eight-month period. China therefore benefited in part from a change in supply geography, not simply an expansion of worldwide construction demand.

Which Dry-Bulk Stakeholders Have the Greatest Exposure?

The effects depend on cargo type, vessel size, route distance and whether additional cargoes replace other suppliers. These are market implications, not a list of confirmed individual shipowner gains or losses.

↔ Top and bottom scrollbars are synchronized.
Shipping SegmentMarket DevelopmentPotential OpportunityWhat Could Limit the Benefit
HandysizeHigher Chinese exports of industrial minerals, cement and steel-related cargoes.More loading opportunities for smaller geared ships and terminals without extensive shore cranes.Short-haul routes, cargo handling costs and competition from other geared vessels.
Supramax / UltramaxChinese clinker export tonne-miles rose sharply; IFCHOR attributes 28% of segment-wide growth to these shipments.Longer clinker voyages, including West African demand, can absorb additional vessel days.Regional cement production, Nigerian competition and changing trade routes could reduce future tonne-miles.
Panamax / KamsarmaxMore outward bulk cargo and changing agricultural and coal import patterns.Selective employment where cargo parcels, loading facilities and destination drafts suit larger vessels.Smaller export parcel sizes and commodity-specific demand may prevent a broad-based benefit.
Capesize / NewcastlemaxChina remains a major importer of ore, particularly bauxite and iron ore.Long-haul Guinea–China bauxite demand continues to support large vessels on a separate inbound cargo chain.The growth in smaller outbound bulk cargoes does not automatically add Capesize demand. Exposure remains concentrated in raw-material imports.
Chinese Bulk TerminalsHigher export loading volumes and expanding diversity of outbound industrial cargo.Potential increases in berth utilization, stockyard handling, loading services and cargo scheduling.Different cargoes require different handling equipment; no individual terminal's incremental revenue is established by national data.
Commodity TradersMore competitive Chinese supply of cement, clinker, limestone and industrial materials.New sourcing options when established producers face disruption or supply constraints.Freight cost, product quality, import tariffs, duties, trade remedies and changes in destination demand.
NoteAdditional cargo tonnes, longer voyages and better vessel earnings are three different outcomes. The first two may support the third, but vessel supply, freight competition, ballast legs, fuel costs and voyage duration determine realized profitability.

Signals to Watch Into 2027

China Export LoadingsWhether November and December maintain the strong pace following September's record of 32.8 million tonnes and October's 29.5 million tonnes.
Geared Bulker EmploymentWhether more vessels can link Chinese discharge cargoes with subsequent export fixtures, reducing ballast time and improving realized voyage earnings.
Clinker Tonne-MilesWhether West African construction demand sustains long-distance clinker movements, or increased regional cement production begins replacing Chinese cargoes.
Limestone TradeWhether Persian Gulf suppliers recover export volumes and regain customers that shifted toward China during the disruption.
Trade RestrictionsWhether new anti-dumping measures, licensing rules or import restrictions affect the competitiveness of Chinese industrial materials abroad.
Large-Vessel ImportsWhether Guinea–China bauxite and other ore trades continue supporting Capesize demand separately from China's outbound cargo expansion.
Important data qualifications: Ursa/Signal Ocean, BRS/AXSMarine, IFCHOR, customs records and S&P Global use different definitions, vessel populations, reporting periods and trade coverage. Their percentages should not be added together. In particular, the 54.4-million-tonne worldwide loading increase and the 54.4-billion-tonne-mile clinker increase are entirely different measurements.

China loaded 274.9 million tonnes of dry-bulk cargo during January–October 2026, an increase of 14.9%, and accounted for approximately 65% of the worldwide rise in loadings. Separate broker research identifies cement, clinker and industrial minerals as important drivers of changing export flows, with especially strong tonne-mile growth for Supramax and Ultramax vessels. The development adds a substantial new source of dry-bulk cargoes while China's traditional role as a major importer continues. Its lasting impact on shipping profitability will depend on export destinations, voyage distances and whether these cargo flows persist into 2027.

Feedback Welcome

We welcome your feedback, suggestions, corrections, and ideas for enhancements.

Please click here to get in touch
By the ShipUniverse Editorial Team — About Us | Contact


← Browse more ShipUniverse posts
MARITIME DECISION TOOLS

Practical tools for real vessel and commercial decisions

Browse the latest 24 tools or instantly search every published ShipUniverse maritime tool.

24 latest toolsView all 320 →
TOOL

Offshore Cable-Laying Vessel Fleet, Installation Scheduling, Weather Downtime & Project Delay Cost Tool

🔔 Subscribe to ShipUniverse Weekly → SHIPUNIVERSE / OFFSHORE CONSTRUCTION ECONOMICS…

Open →
TOOL

Port Electric RTG & Terminal Tractor Fleet, Charging Infrastructure, Grid Capacity & ROI Tool

🔔 Subscribe to ShipUniverse Weekly → SHIPUNIVERSE / TERMINAL ELECTRIFICATION INTELLIGENCE…

Open →
TOOL

Cruise Private Island Investment, Berth Capacity, Guest Spending & Destination Profitability Tool

🔔 Subscribe to ShipUniverse Weekly → SHIPUNIVERSE / CRUISE DESTINATION INVESTMENT…

Open →
TOOL

FSRU Regasification Capacity, LNG Send-Out, Gas Offtake Contracts & Conversion ROI Tool

🔔 Subscribe to ShipUniverse Weekly → SHIPUNIVERSE / FLOATING LNG REGASIFICATION…

Open →
TOOL

Offshore CO₂ Shipping Supply Chain, LCO₂ Carrier Fleet Sizing, Terminal Slots & Transport Economics Tool

🔔 Subscribe to ShipUniverse Weekly → SHIPUNIVERSE / OFFSHORE CARBON TRANSPORT…

Open →
TOOL

Shipyard Production Capacity, Critical Supplier Bottlenecks, Workforce Allocation & Newbuild Delay Cost Tool

🔔 Subscribe to ShipUniverse Weekly → SHIPUNIVERSE / SHIPBUILDING OPERATIONS &…

Open →
TOOL

Cruise Shore Excursion Capacity, Tour Operator Revenue Share, Cancellation Risk & Port-Day Profitability Tool

🔔 Subscribe to ShipUniverse Weekly → SHIPUNIVERSE / CRUISE & DESTINATION…

Open →
TOOL

Maritime GNSS Jamming & Spoofing, Backup Navigation Readiness, Voyage Delay & Retrofit ROI Tool

🔔 Subscribe to ShipUniverse Weekly → SHIPUNIVERSE / BRIDGE RESILIENCE &…

Open →
TOOL

Fleet Vessel Deployment, Ballast Positioning, Charter Opportunities & TCE Optimization Tool

🔔 Subscribe to ShipUniverse Weekly → SHIPUNIVERSE / COMMERCIAL FLEET DECISION…

Open →
TOOL

Port Terminal Operating System Upgrade, Automation Tender, Operational Downtime & CAPEX ROI Tool

🔔 Subscribe to ShipUniverse Weekly → SHIPUNIVERSE / PORT SYSTEMS &…

Open →
TOOL

Floating LNG Storage Unit Investment, Bunkering Slots, Open-Access Fees & Charter ROI Tool

🔔 Subscribe to ShipUniverse Weekly → SHIPUNIVERSE / LNG INFRASTRUCTURE &…

Open →
TOOL

Panama Canal Transit Slot Auction, Waiting Time, Draft Restrictions & Route Diversion Economics Tool

🔔 Subscribe to ShipUniverse Weekly → ShipUniverse / Canal Access &…

Open →
TOOL

Offshore Wind O&M Vessel Fleet, CTV/SOV Scheduling, Technician Transfers & Turbine Downtime Cost Tool

🔔 Subscribe to ShipUniverse Weekly → ShipUniverse / offshore wind operations…

Open →
TOOL

Vessel Sale & Purchase Closing, Escrow, Bunker ROB, Delivery Documents & Cash Settlement Tool

🔔 Subscribe to ShipUniverse Weekly → SHIPUNIVERSE / VESSEL TRANSACTION INTELLIGENCE…

Open →
TOOL

Harbor Tug Fleet Contract Tender, Utilization, Standby Fees & Towage Profitability Tool

🔔 Subscribe to ShipUniverse Weekly → SHIPUNIVERSE / PORT & TOWAGE…

Open →
TOOL

Marine General Average, Cargo Contribution, Security Deposits & Claims Settlement Exposure Tool

🔔 Subscribe to ShipUniverse Weekly → SHIPUNIVERSE / MARITIME CLAIMS &…

Open →
TOOL

Chemical Tanker Cargo Parcel Allocation, Tank Compatibility, Cleaning Turnaround & Voyage Margin Tool

🔔 Subscribe to ShipUniverse Weekly → SHIP UNIVERSE / CHEMICAL TANKER…

Open →
TOOL

Marine Insurance Claims Portfolio, Hull & P&I Loss Runs, Reserves & Renewal Negotiation Tool

🔔 Subscribe to ShipUniverse Weekly → SHIPUNIVERSE / FLEET INSURANCE &…

Open →
TOOL

Offshore Platform Decommissioning, Vessel Spread, Weather Windows & Removal Campaign Cost Tool

🔔 Subscribe to ShipUniverse Weekly → SHIPUNIVERSE / OFFSHORE ASSET RETIREMENT…

Open →
TOOL

Tanker & Bulker Commercial Pool, Fleet Earnings Distribution, Off-Hire & Pooling Economics Tool

🔔 Subscribe to ShipUniverse Weekly → SHIPUNIVERSE / COMMERCIAL SHIPPING INTELLIGENCE…

Open →
TOOL

Port Terminal Concession Bid, Throughput Guarantees, Tariff Escalation & Investment NPV Tool

🔔 Subscribe to ShipUniverse Weekly → SHIPUNIVERSE / PORT INFRASTRUCTURE INVESTMENT…

Open →
TOOL

Fleet Debt Covenant Headroom, Vessel Valuation Shock, Interest Rates & Refinancing Liquidity Tool

🔔 Subscribe to ShipUniverse Weekly → SHIPUNIVERSE / FLEET FINANCING INTELLIGENCE…

Open →
TOOL

Maritime Freight FFA Hedging, Bunker Price Risk, Margin Calls & Cash-Flow Protection Tool

🔔 Subscribe to ShipUniverse Weekly → SHIPUNIVERSE / FREIGHT DERIVATIVES &…

Open →
TOOL

Empty Container Repositioning, Depot Inventory, Leasing & Shortage Cost Tool

🔔 Subscribe to ShipUniverse Weekly → SHIPUNIVERSE / CONTAINER EQUIPMENT NETWORK…

Open →